ezActi—A Software Application for Actigraphy Analysis

Credit © Peng Li, Ph.D.
An investor? A donor? Interested in this research and development? Please contact me. Let’s chat!
Though algorithm details and mathematical formulas are readily available for analyzing rest-activity patterns using actigraphy, we realize that it would be challenging for researchers without strong programming backgrounds to conveniently implement them.
Actigraphy allows a non-invasive and cost-effective assessment of the functional manifestation of the circadian control under naturalistic settings in terms of rest-activity patterns, which enables scalable applications in population and large cohort study settings.
We developed a software application, ezActi, in the MATLAB© platform (R2024a and later versions, The MathWorks Inc., Natick, MA) that implements a number of algorithms for rest-activity rhythms analysis. We hope that such an application will ease and facilitate these analyses in a wider community within and beyond the network of sleep and circadian biologists, physiologists, and clinicians.
The current release represents the third major updates, and thus the software application is formally named “ezActi3.” In ezActi3, we implemented the conversion from accelerometer signals to activity counts data to facilitate the processing with many modern watches that provide access to raw accelerometer signals.
Recommended reading materials
- C Gao, et al. Approaches for assessing circadian rest-activity patterns using actigraphy for cohort and population-based studies. Current Sleep Medicine Reports 2023. Link to the article
- P Li. pliphd/Actigraphy. Zenodo 2023.

- P Li. The actigraphy project. GitHub
I kindly ask that you cite the above-referenced article(s) if you use ezActi2 in your research and publications.
If you want to skip the reading below, please download ezActi3 here . Going through the following introduction is highly recommended.
About ezActi3
The ezActi3 was programmed in an object-oriented style and was constructed with a graphical user interface.
The user interface of ezActi3. Credit © Peng Li, Ph.D.
The ezActi3 is easy to operate through its compact graphical interface, allowing researchers without knowledge of programming to perform various kinds of analysis. The ezActi3 is quite easy to operate with only few clicks to perform widely-used rest-activity rhythms analysis. And it comes with a couple of different calculation options so as to adjust input parameters, to batch process multiple signal recordings, to visualize results, and so on. Analysis results are automatically stored to comma-separated ASCII files, thus being compatible to and easily imported into the common statistical analysis software.
What can ezActi3 do?
Converting 3-D accelerometer signals to activity counts data for sleep and circadian rhythms analyses
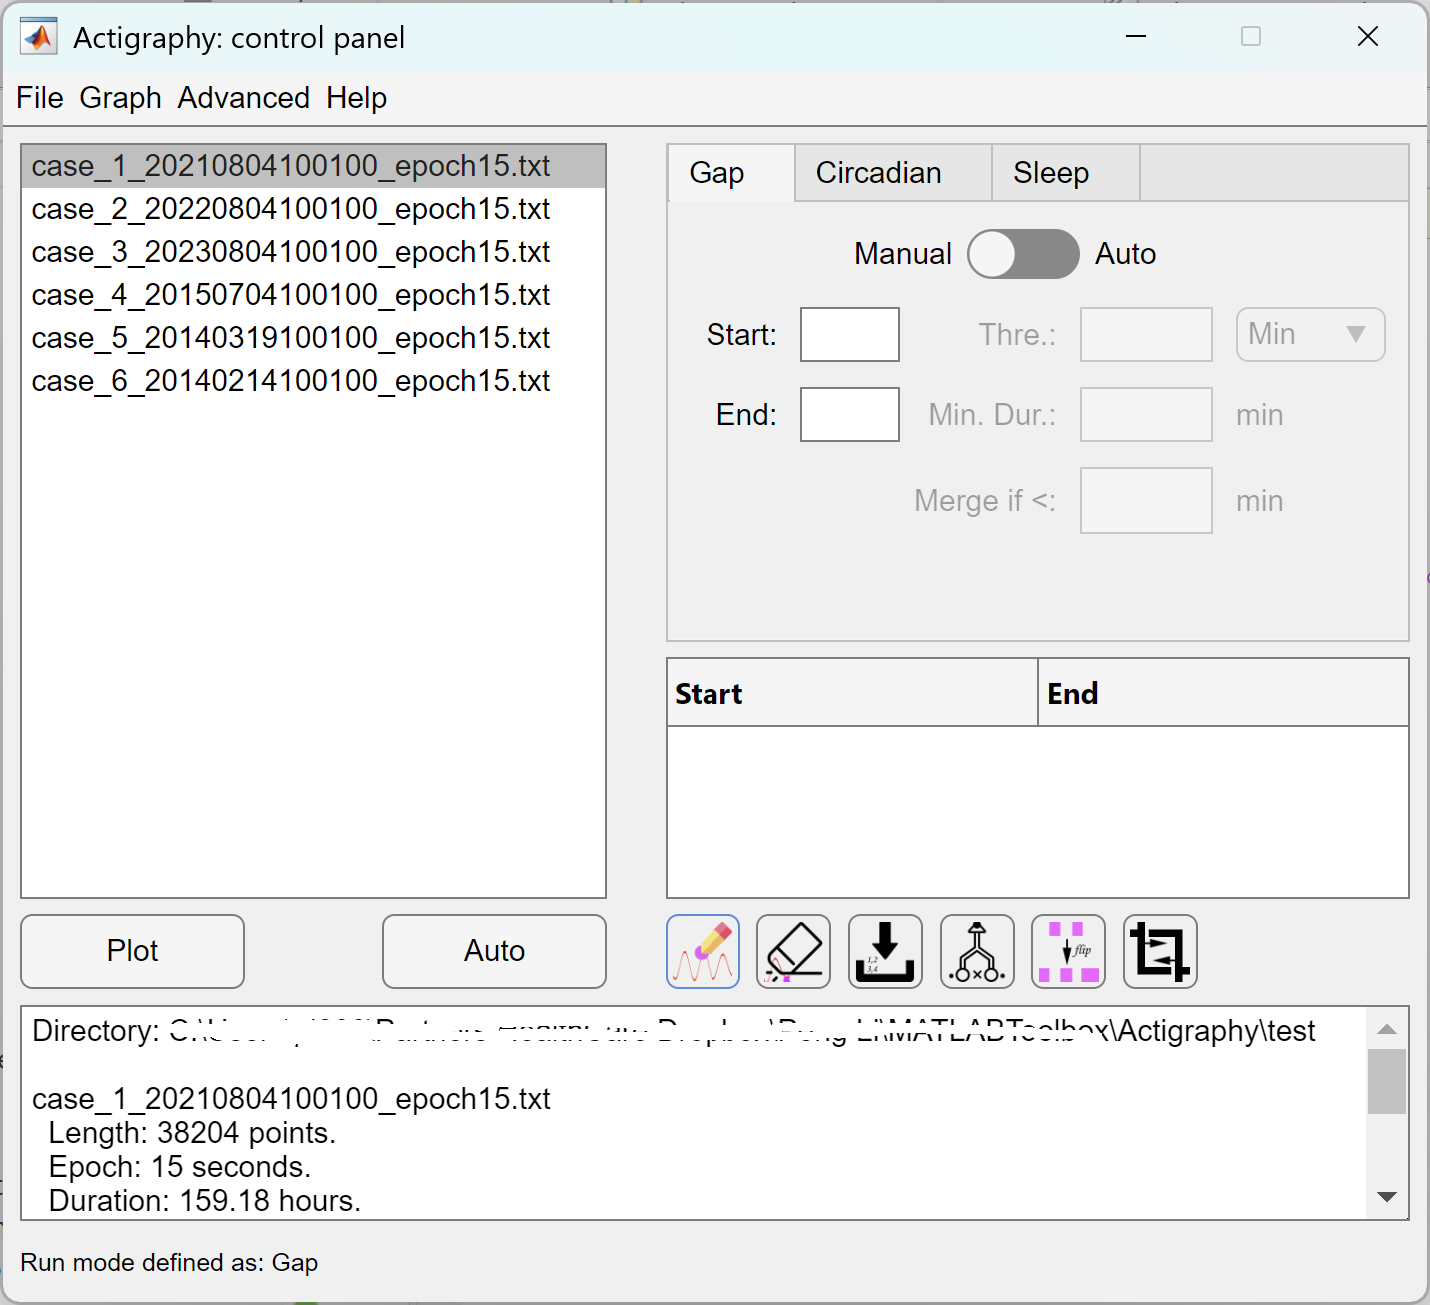
The ezActi3 features a slightly different interface if running the raw data processing functionality, as shown below.
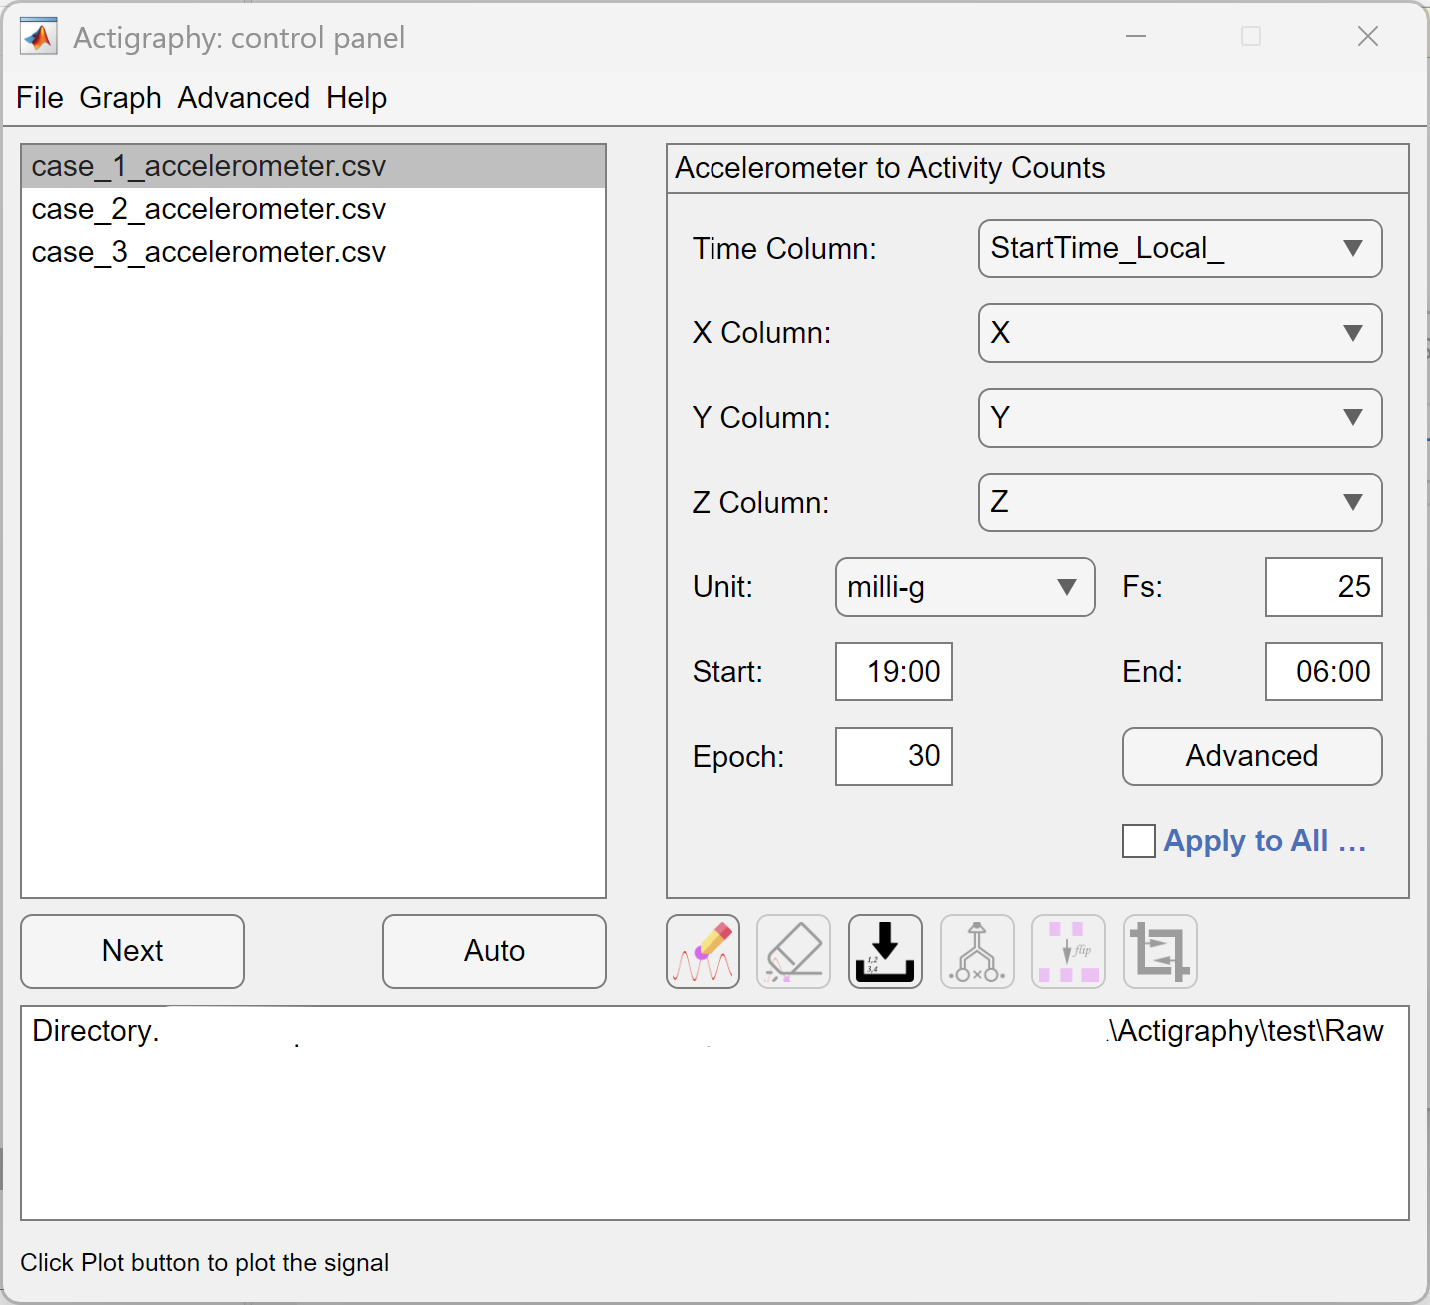
The user interface of ezActi3 when working with raw 3-dimensional accelerometer data. Credit © Peng Li, Ph.D.
Loading the data will naturally take time (for example, 2-3 minutes for a 10-day data file with 25 Hz sampling frequency on a Windows computer with 64 GB RAM, i9-11900H @ 2.50 GHz). A preview tool will pop out after loading the data, as shown below.
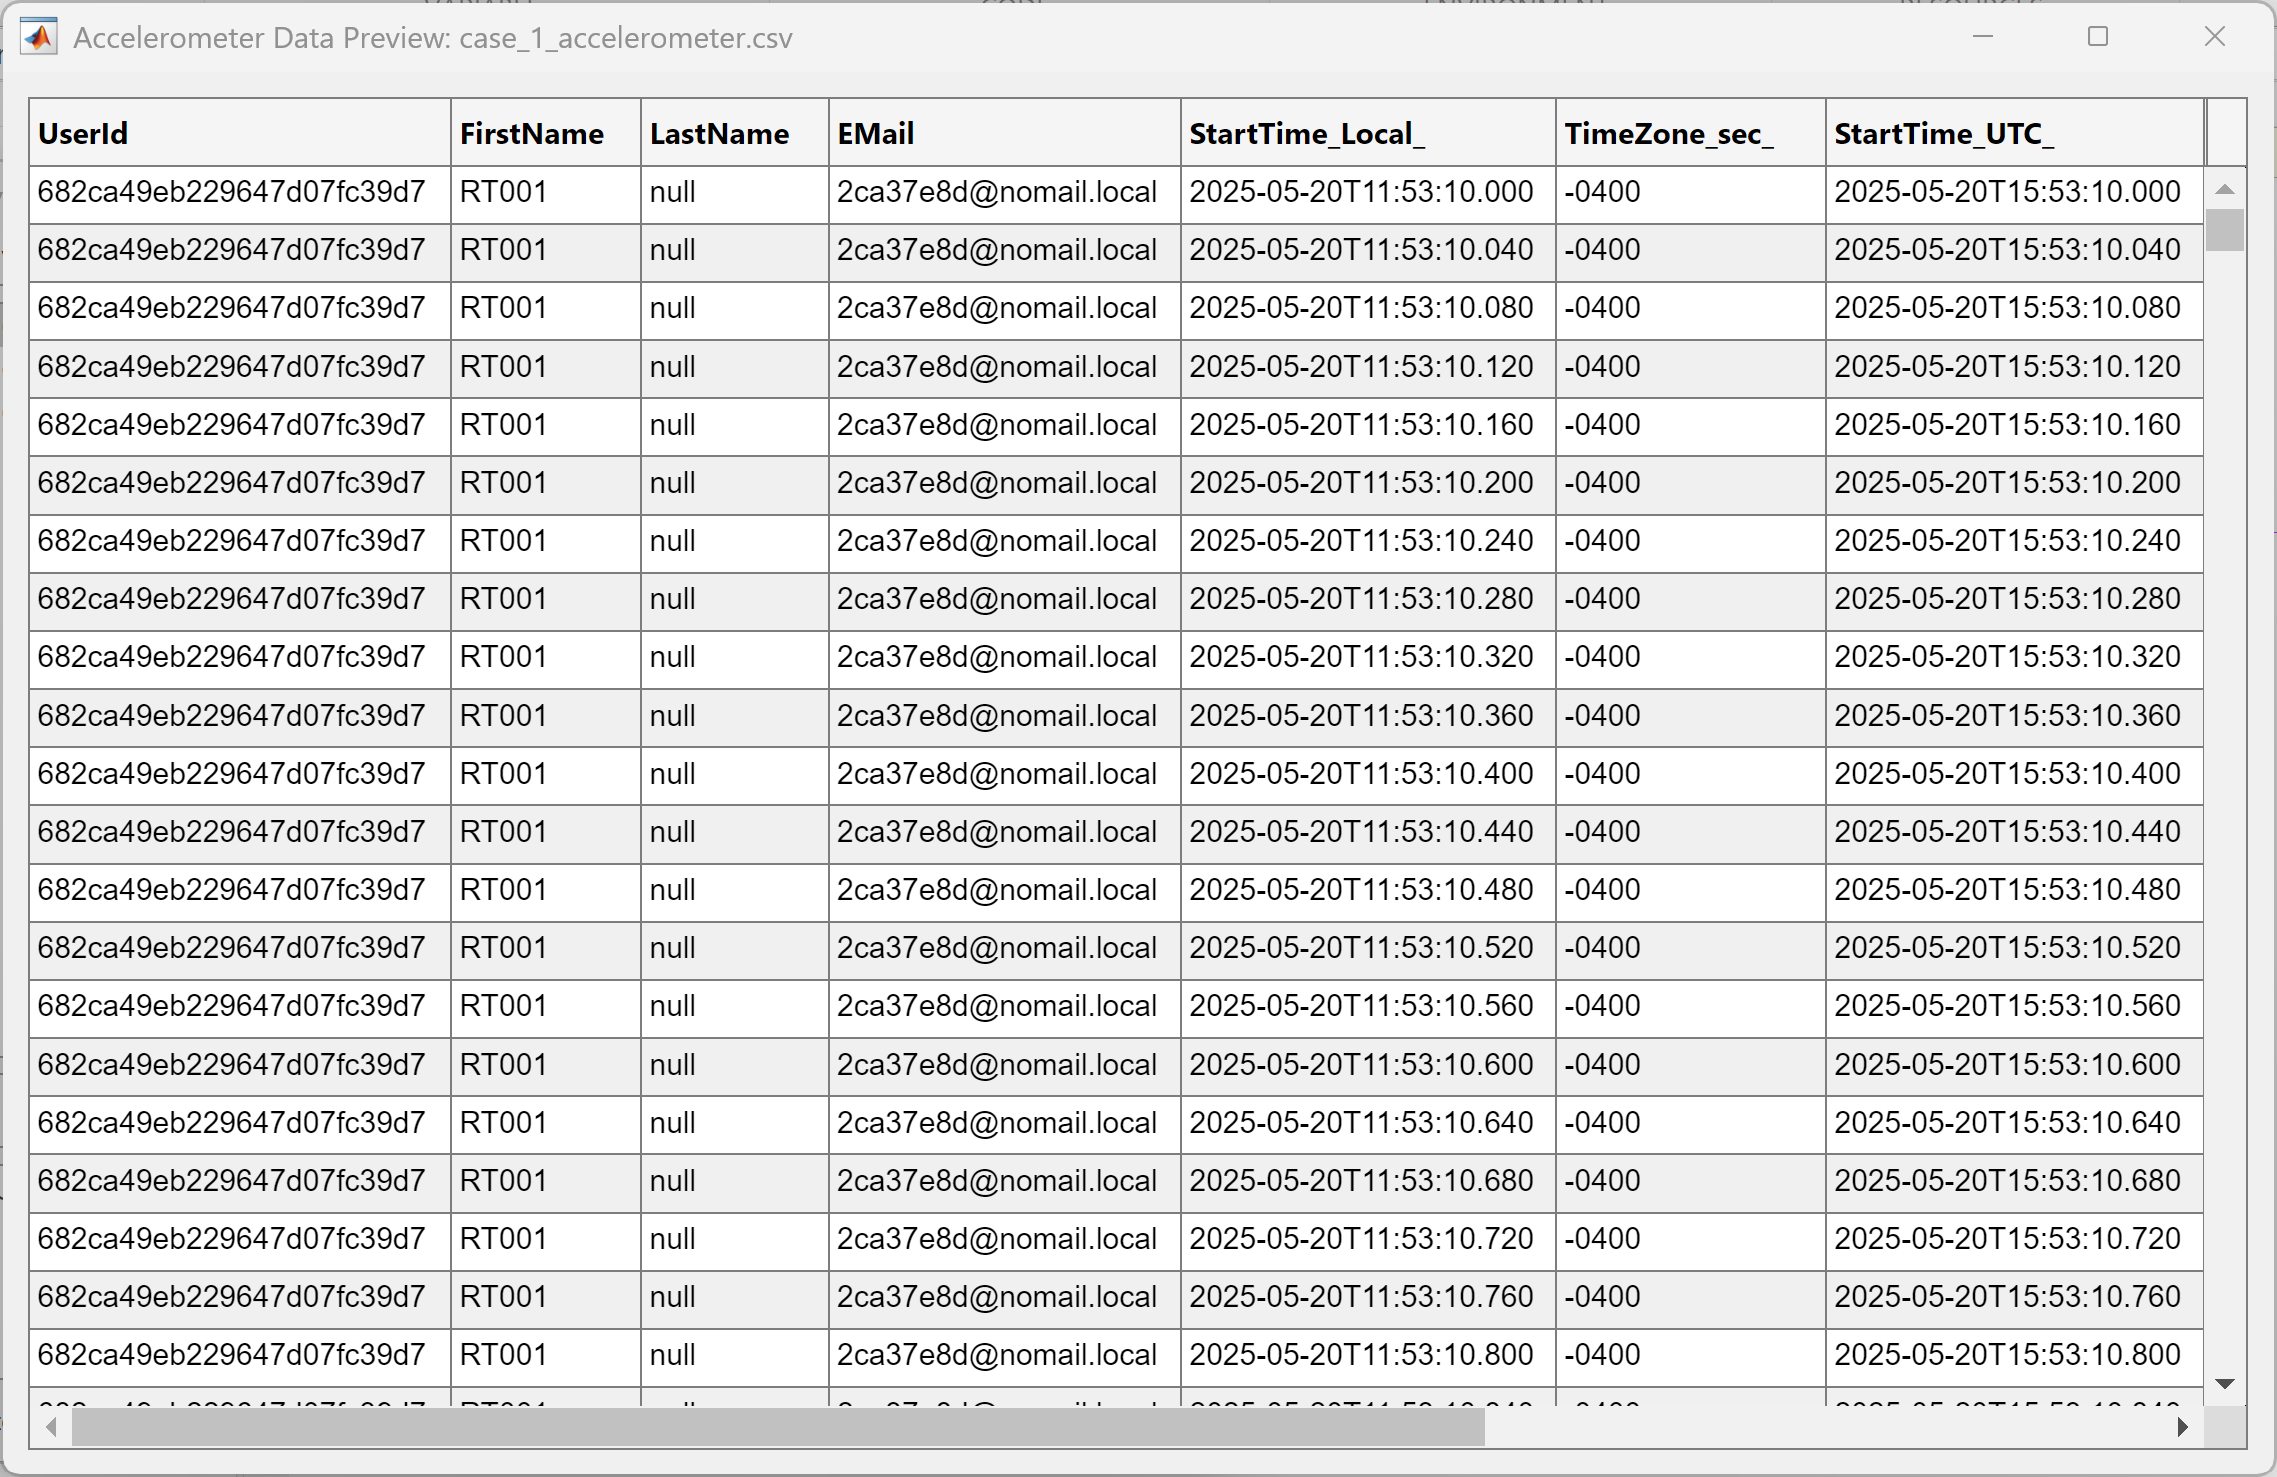
Visualization of accelerometer signals using preview. Credit © Peng Li, Ph.D.
With the preview, users can correctly config the loading as different watches may end up with different variable settings for these parameters. I find out that this might be the most efficient way to facilitate different scenarios. Users can define what time to start the conversion and what time to end it. This feature is to allow the trim of data, since usually people do not quite want to keep the first and the last several hours of data as they can be contaminated due to many reasons.
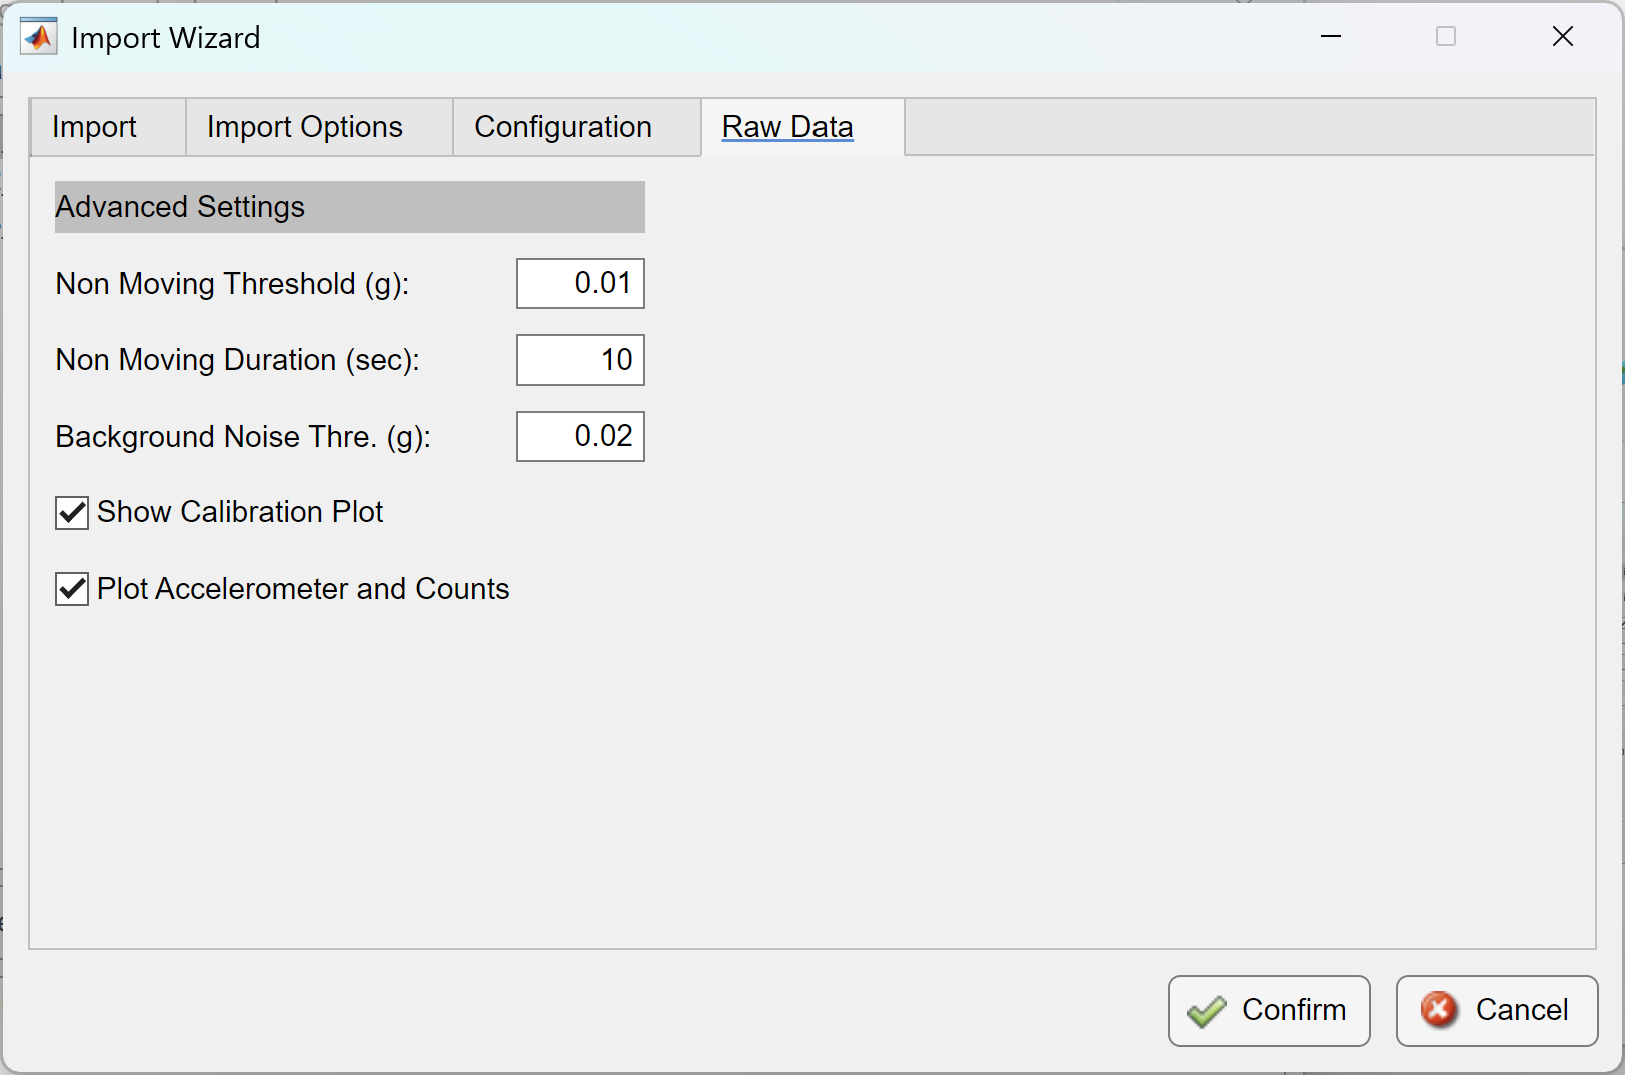
By default, ezActi3 will re-calibrate the signals and try to filter out some background noise. These settings and parameters can be adjusted through the “Advanced” button. Changing these settings require that you understand the algorithm and your device well.
The ezActi3 will show the re-calibration plot and the final results (accelerometer signals vs. activity counts) by default. If you believe that all your files follow the same setting, you can apply the parameters to all files by checking “Apply to All …”. This will disable the results display to prevent memory leaking.
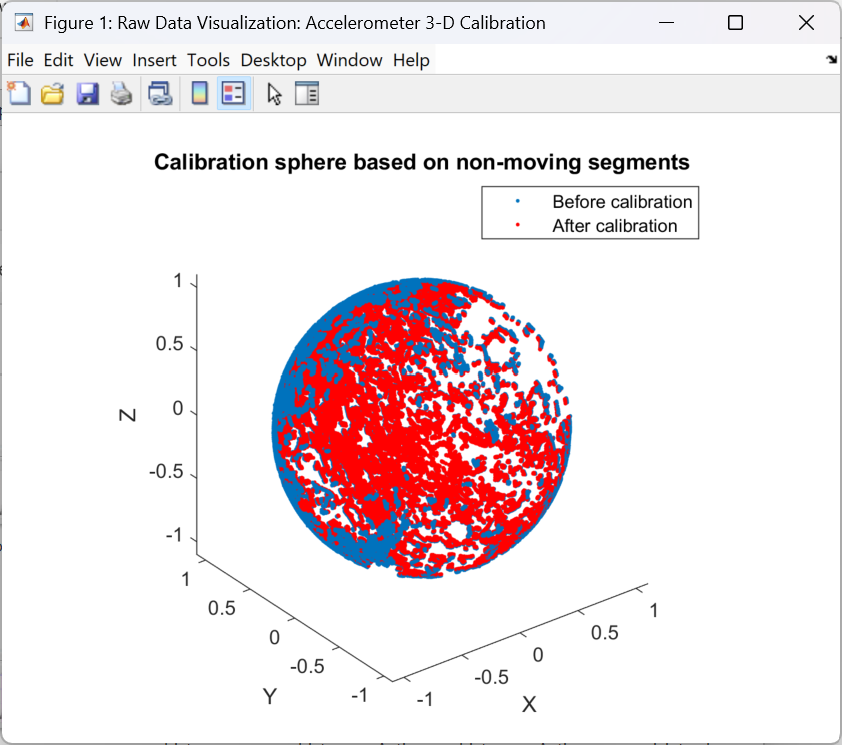
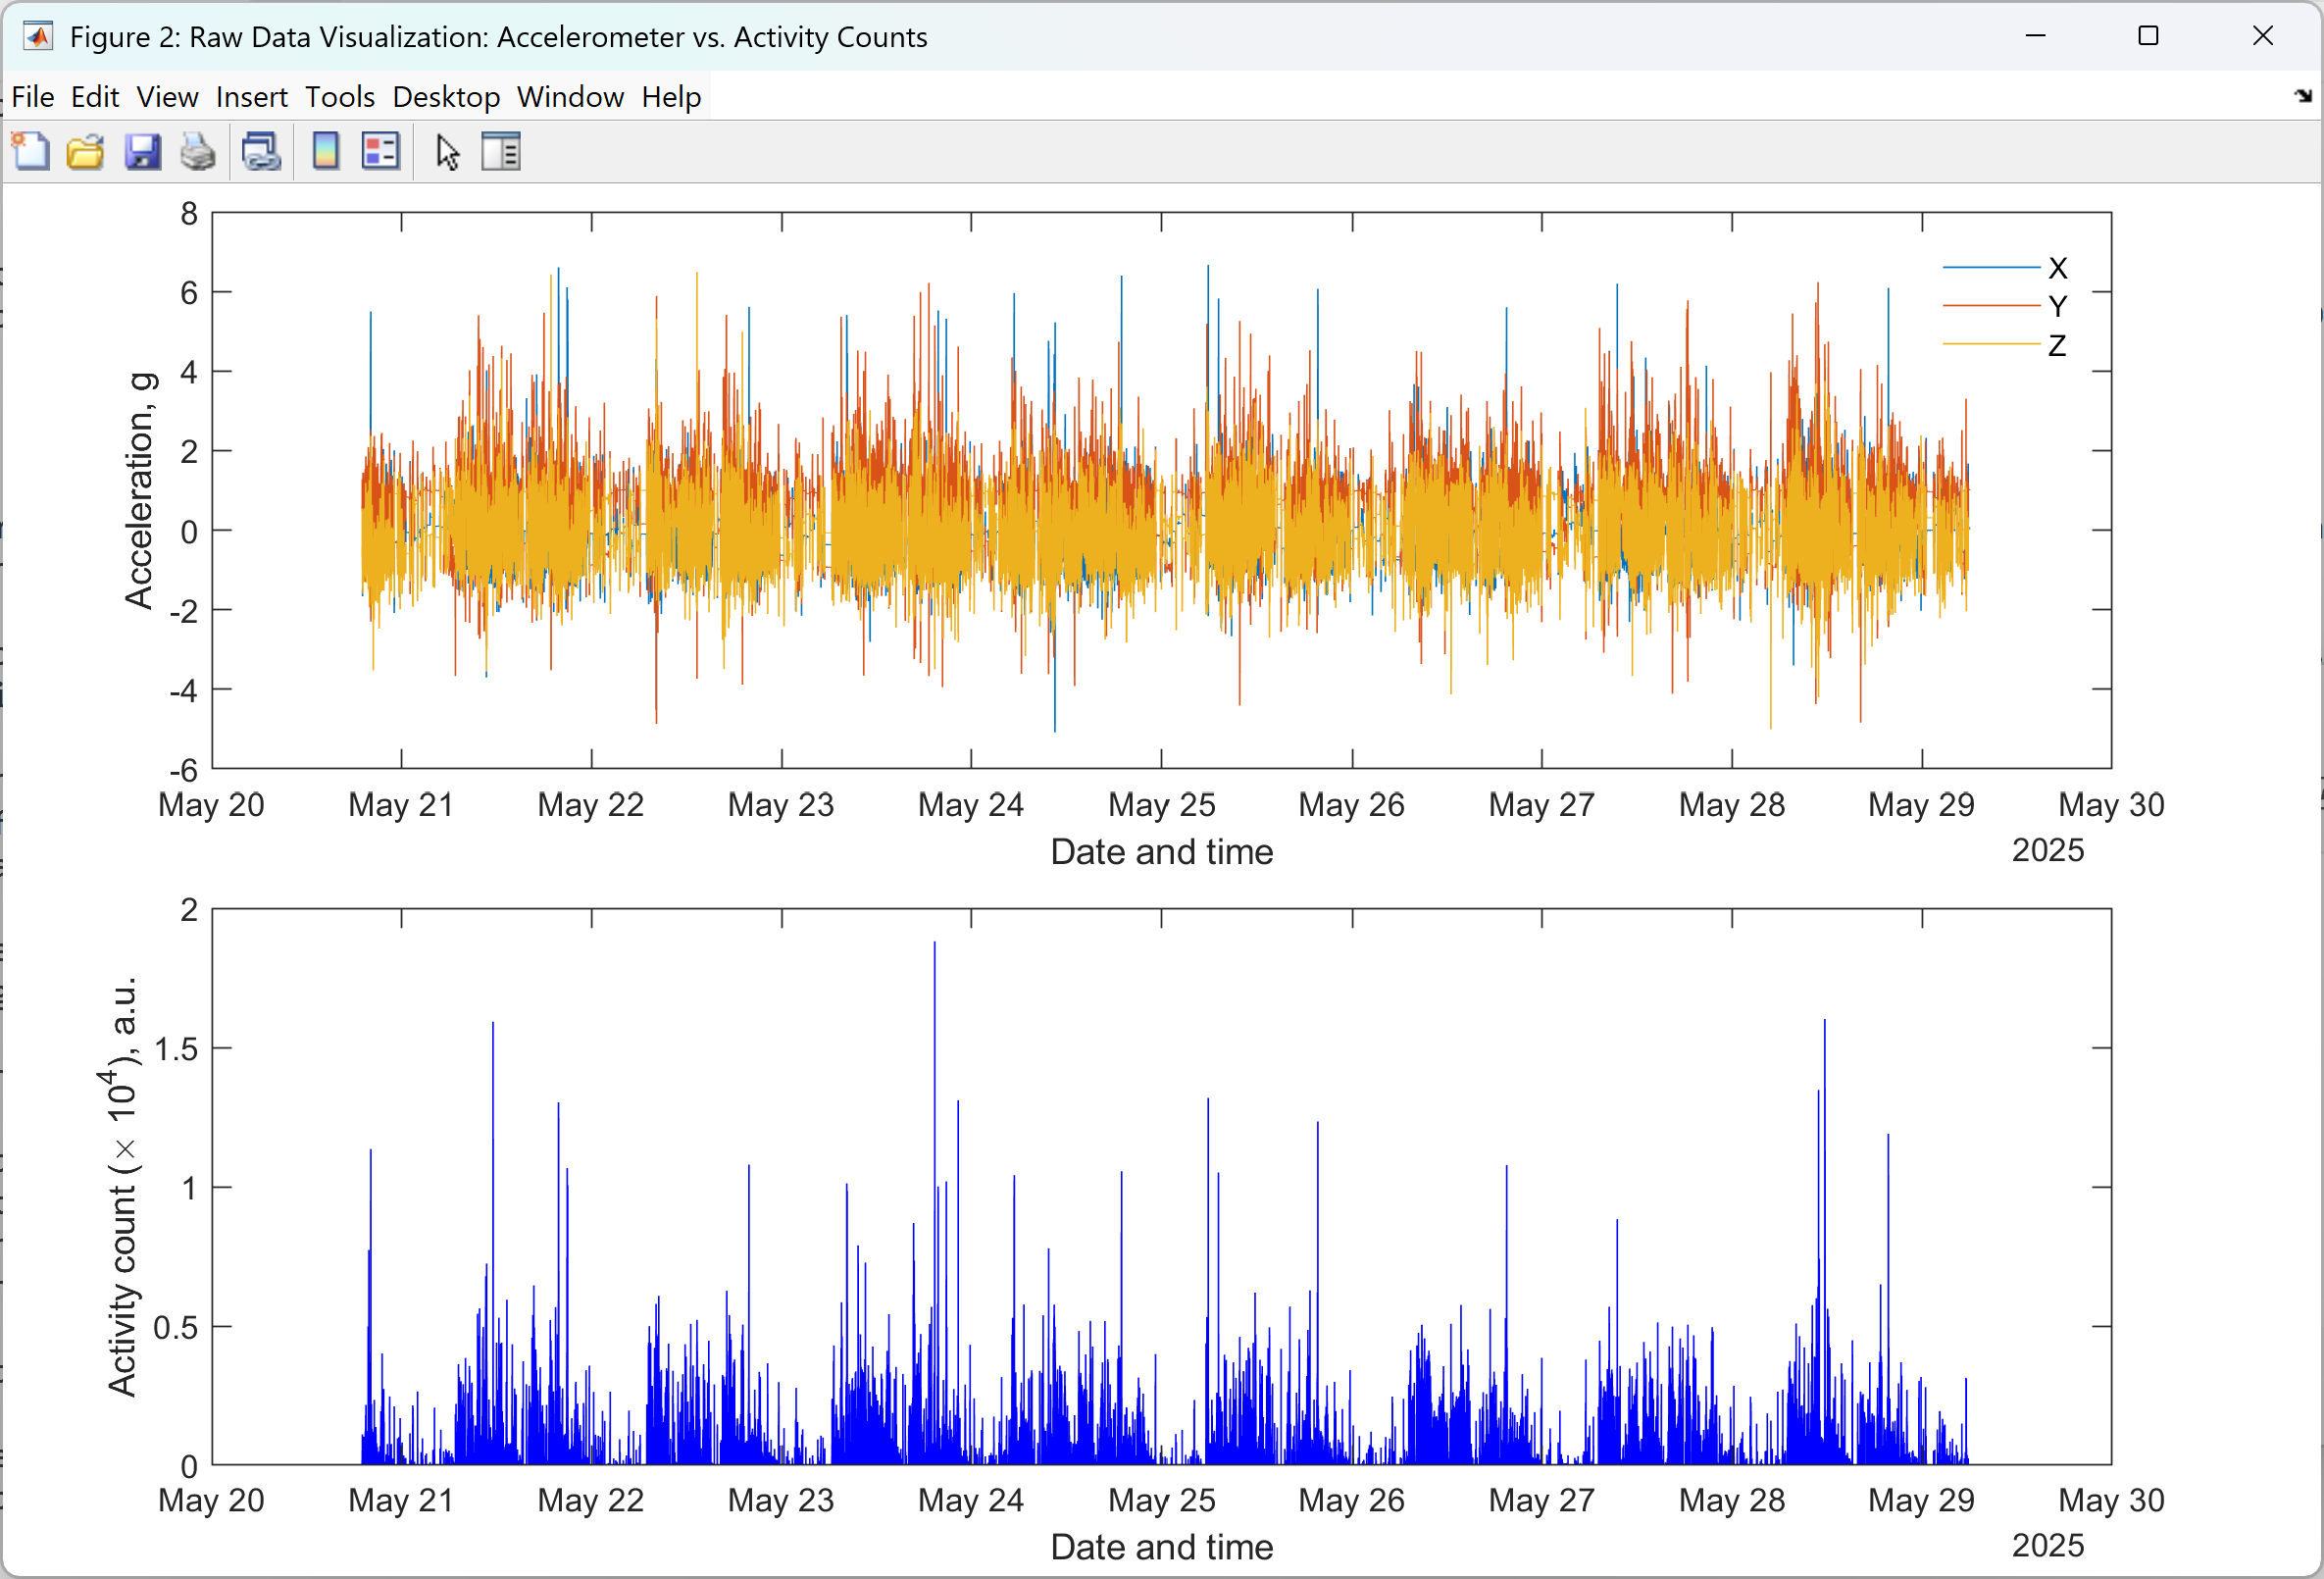
Conversion of accelerometer signals to activity counts. Upper panel: Shown re-calibration results; Lower panel: The comparison of raw accelerometer signals and activity counts. Credit © Peng Li, Ph.D.
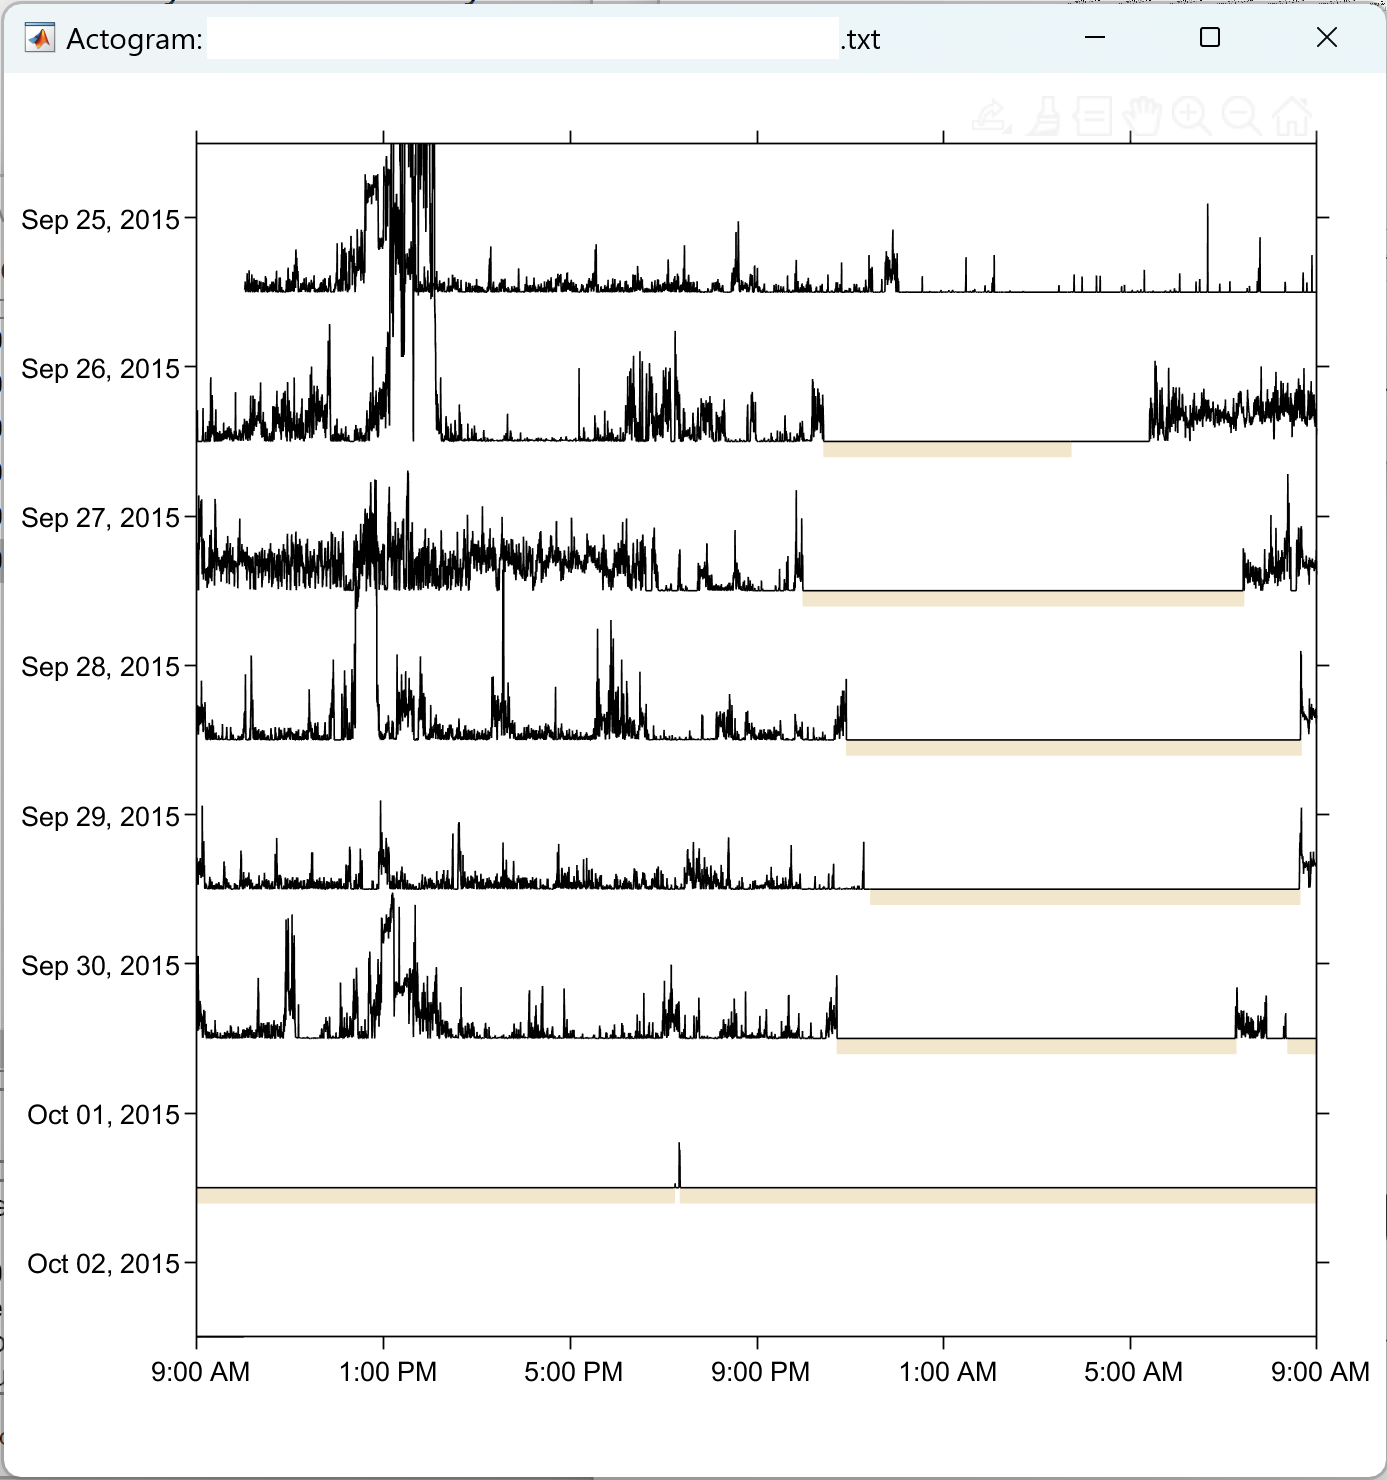
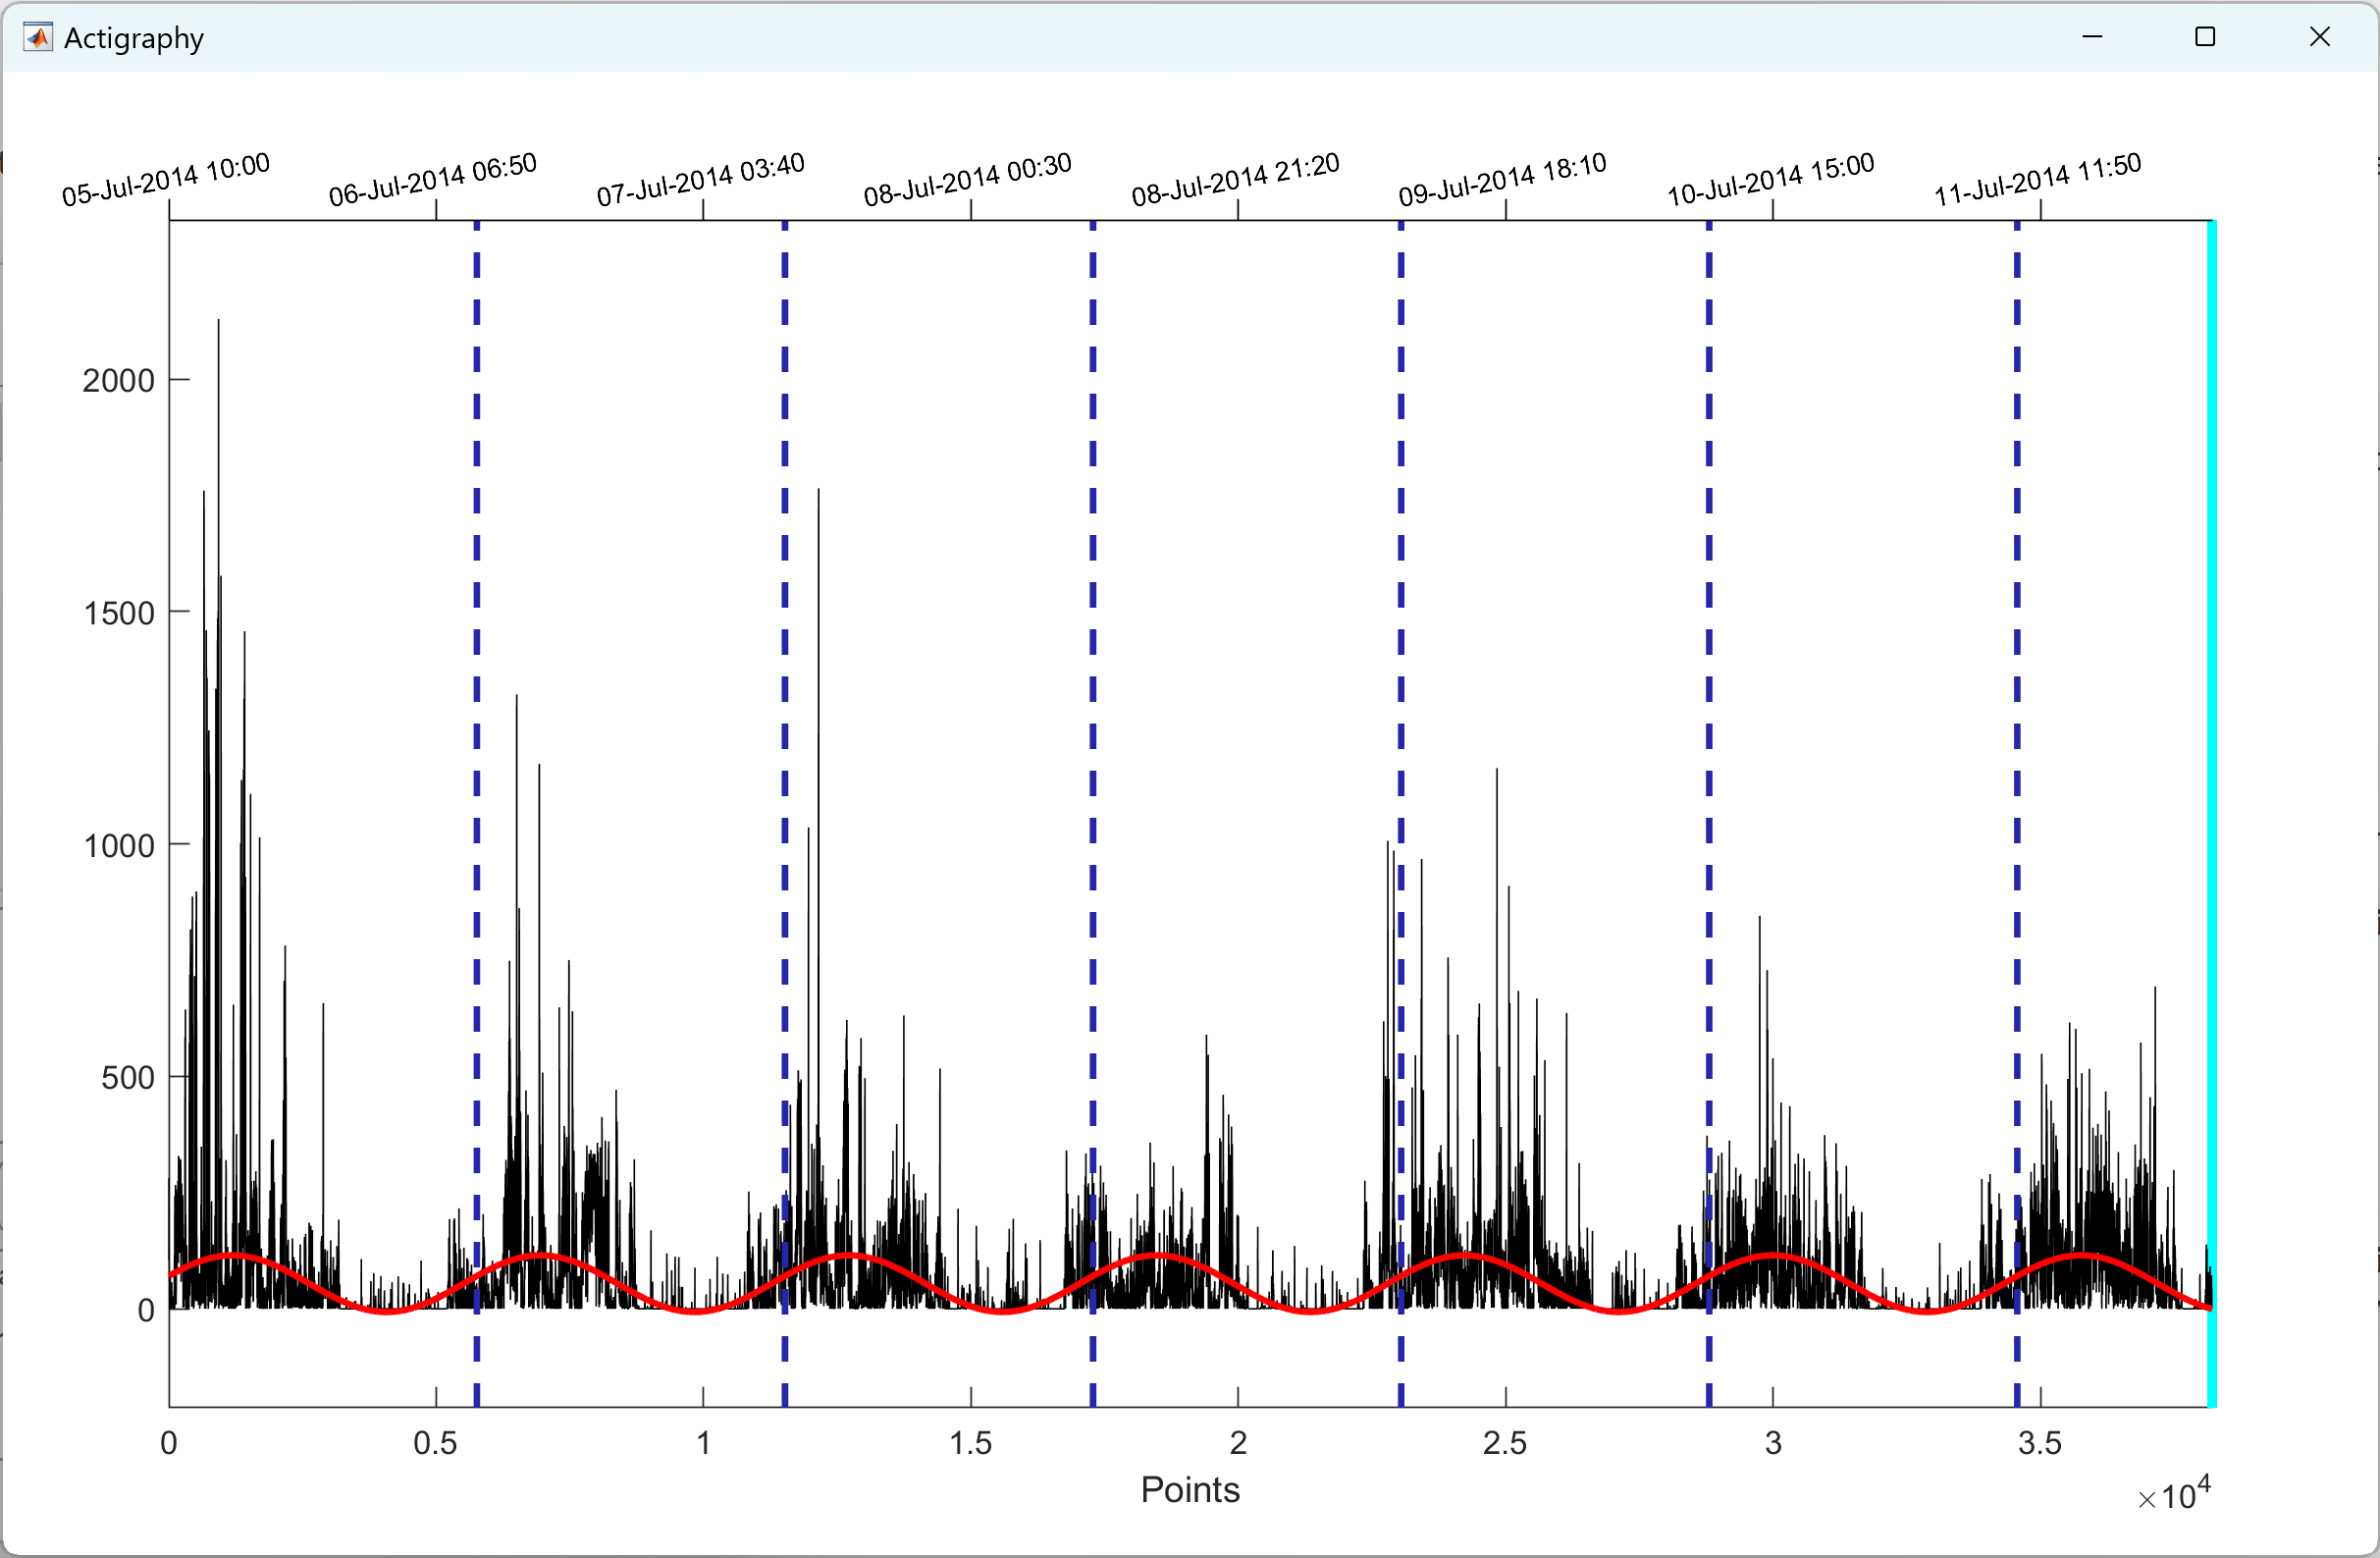
Visualize actigraphy
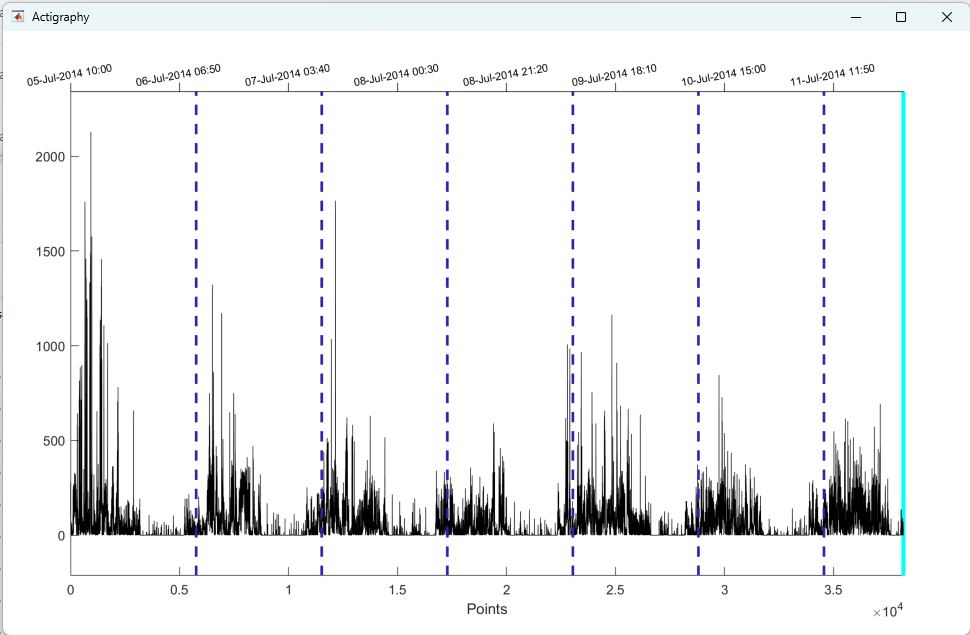
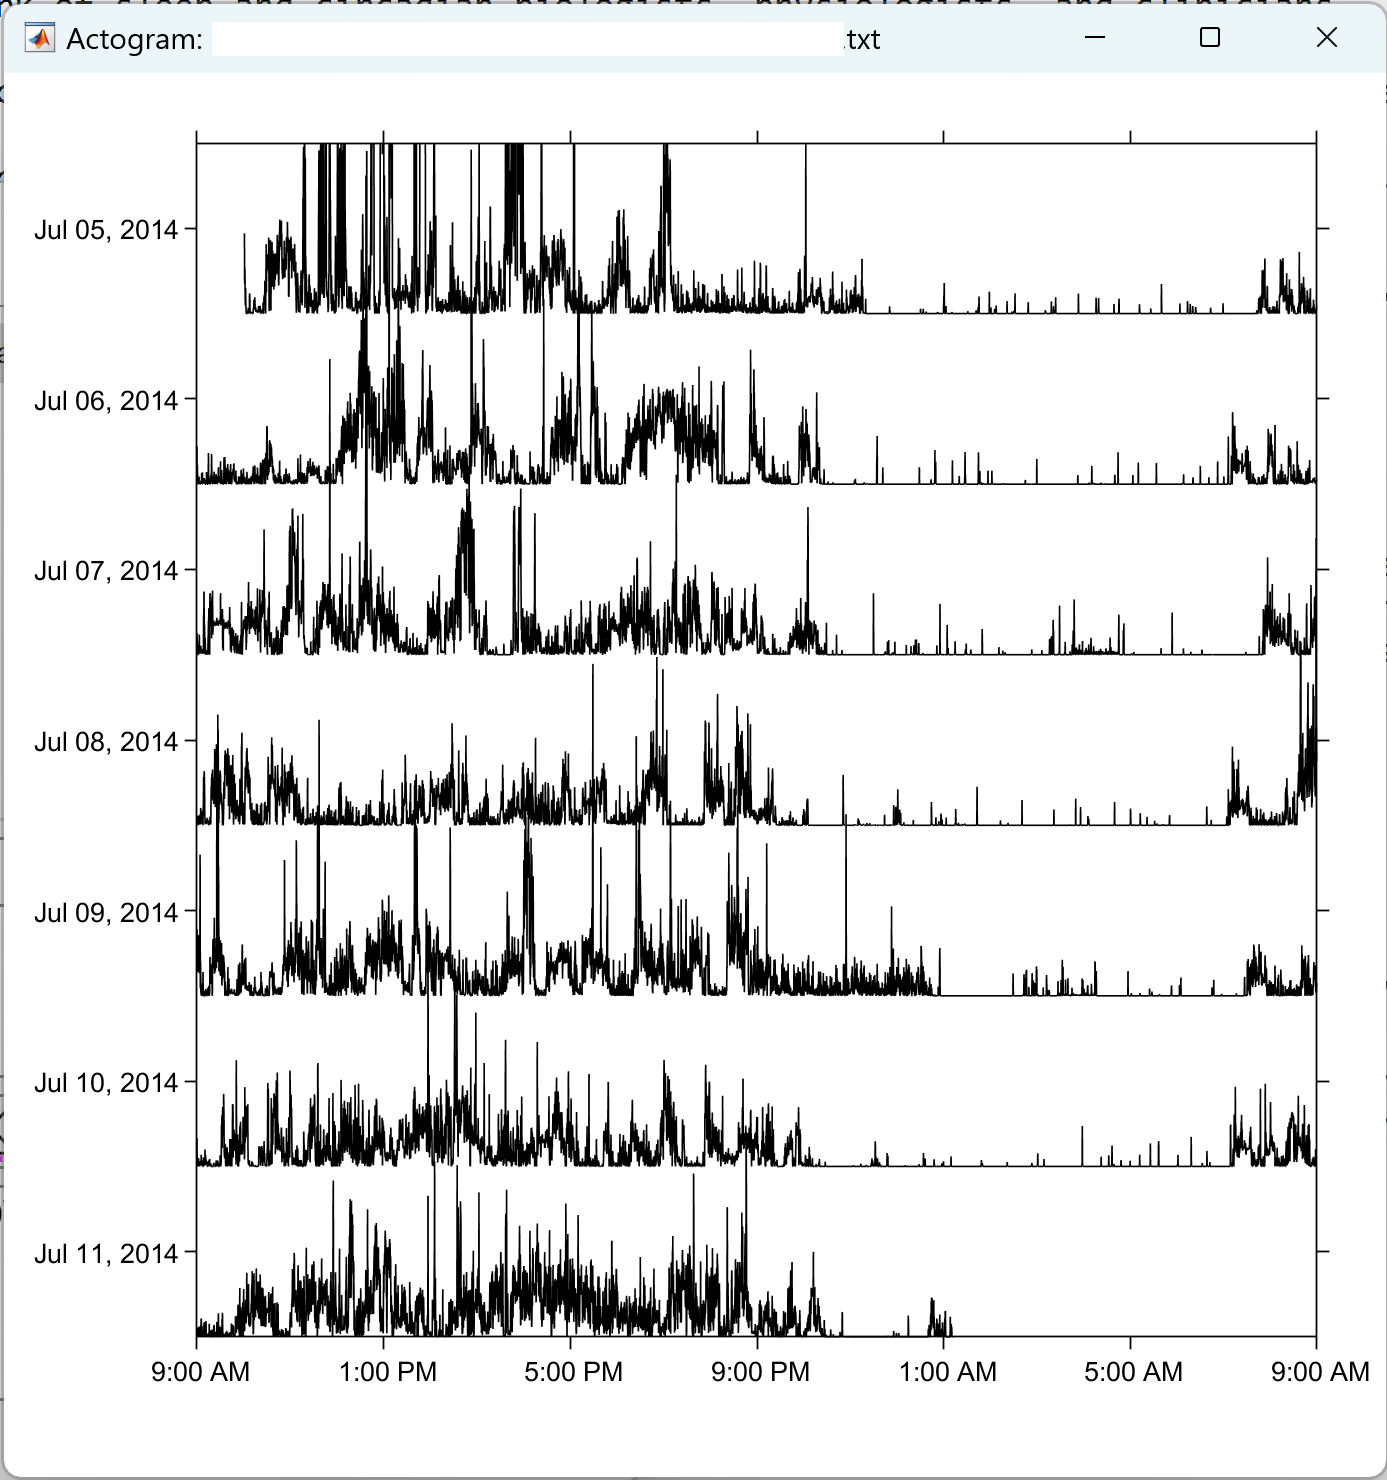
Visualization of actigraphy. Upper panel: The Actigraphy time series; Lower panel: The Actogram plot. Credit © Peng Li, Ph.D.
Quality control
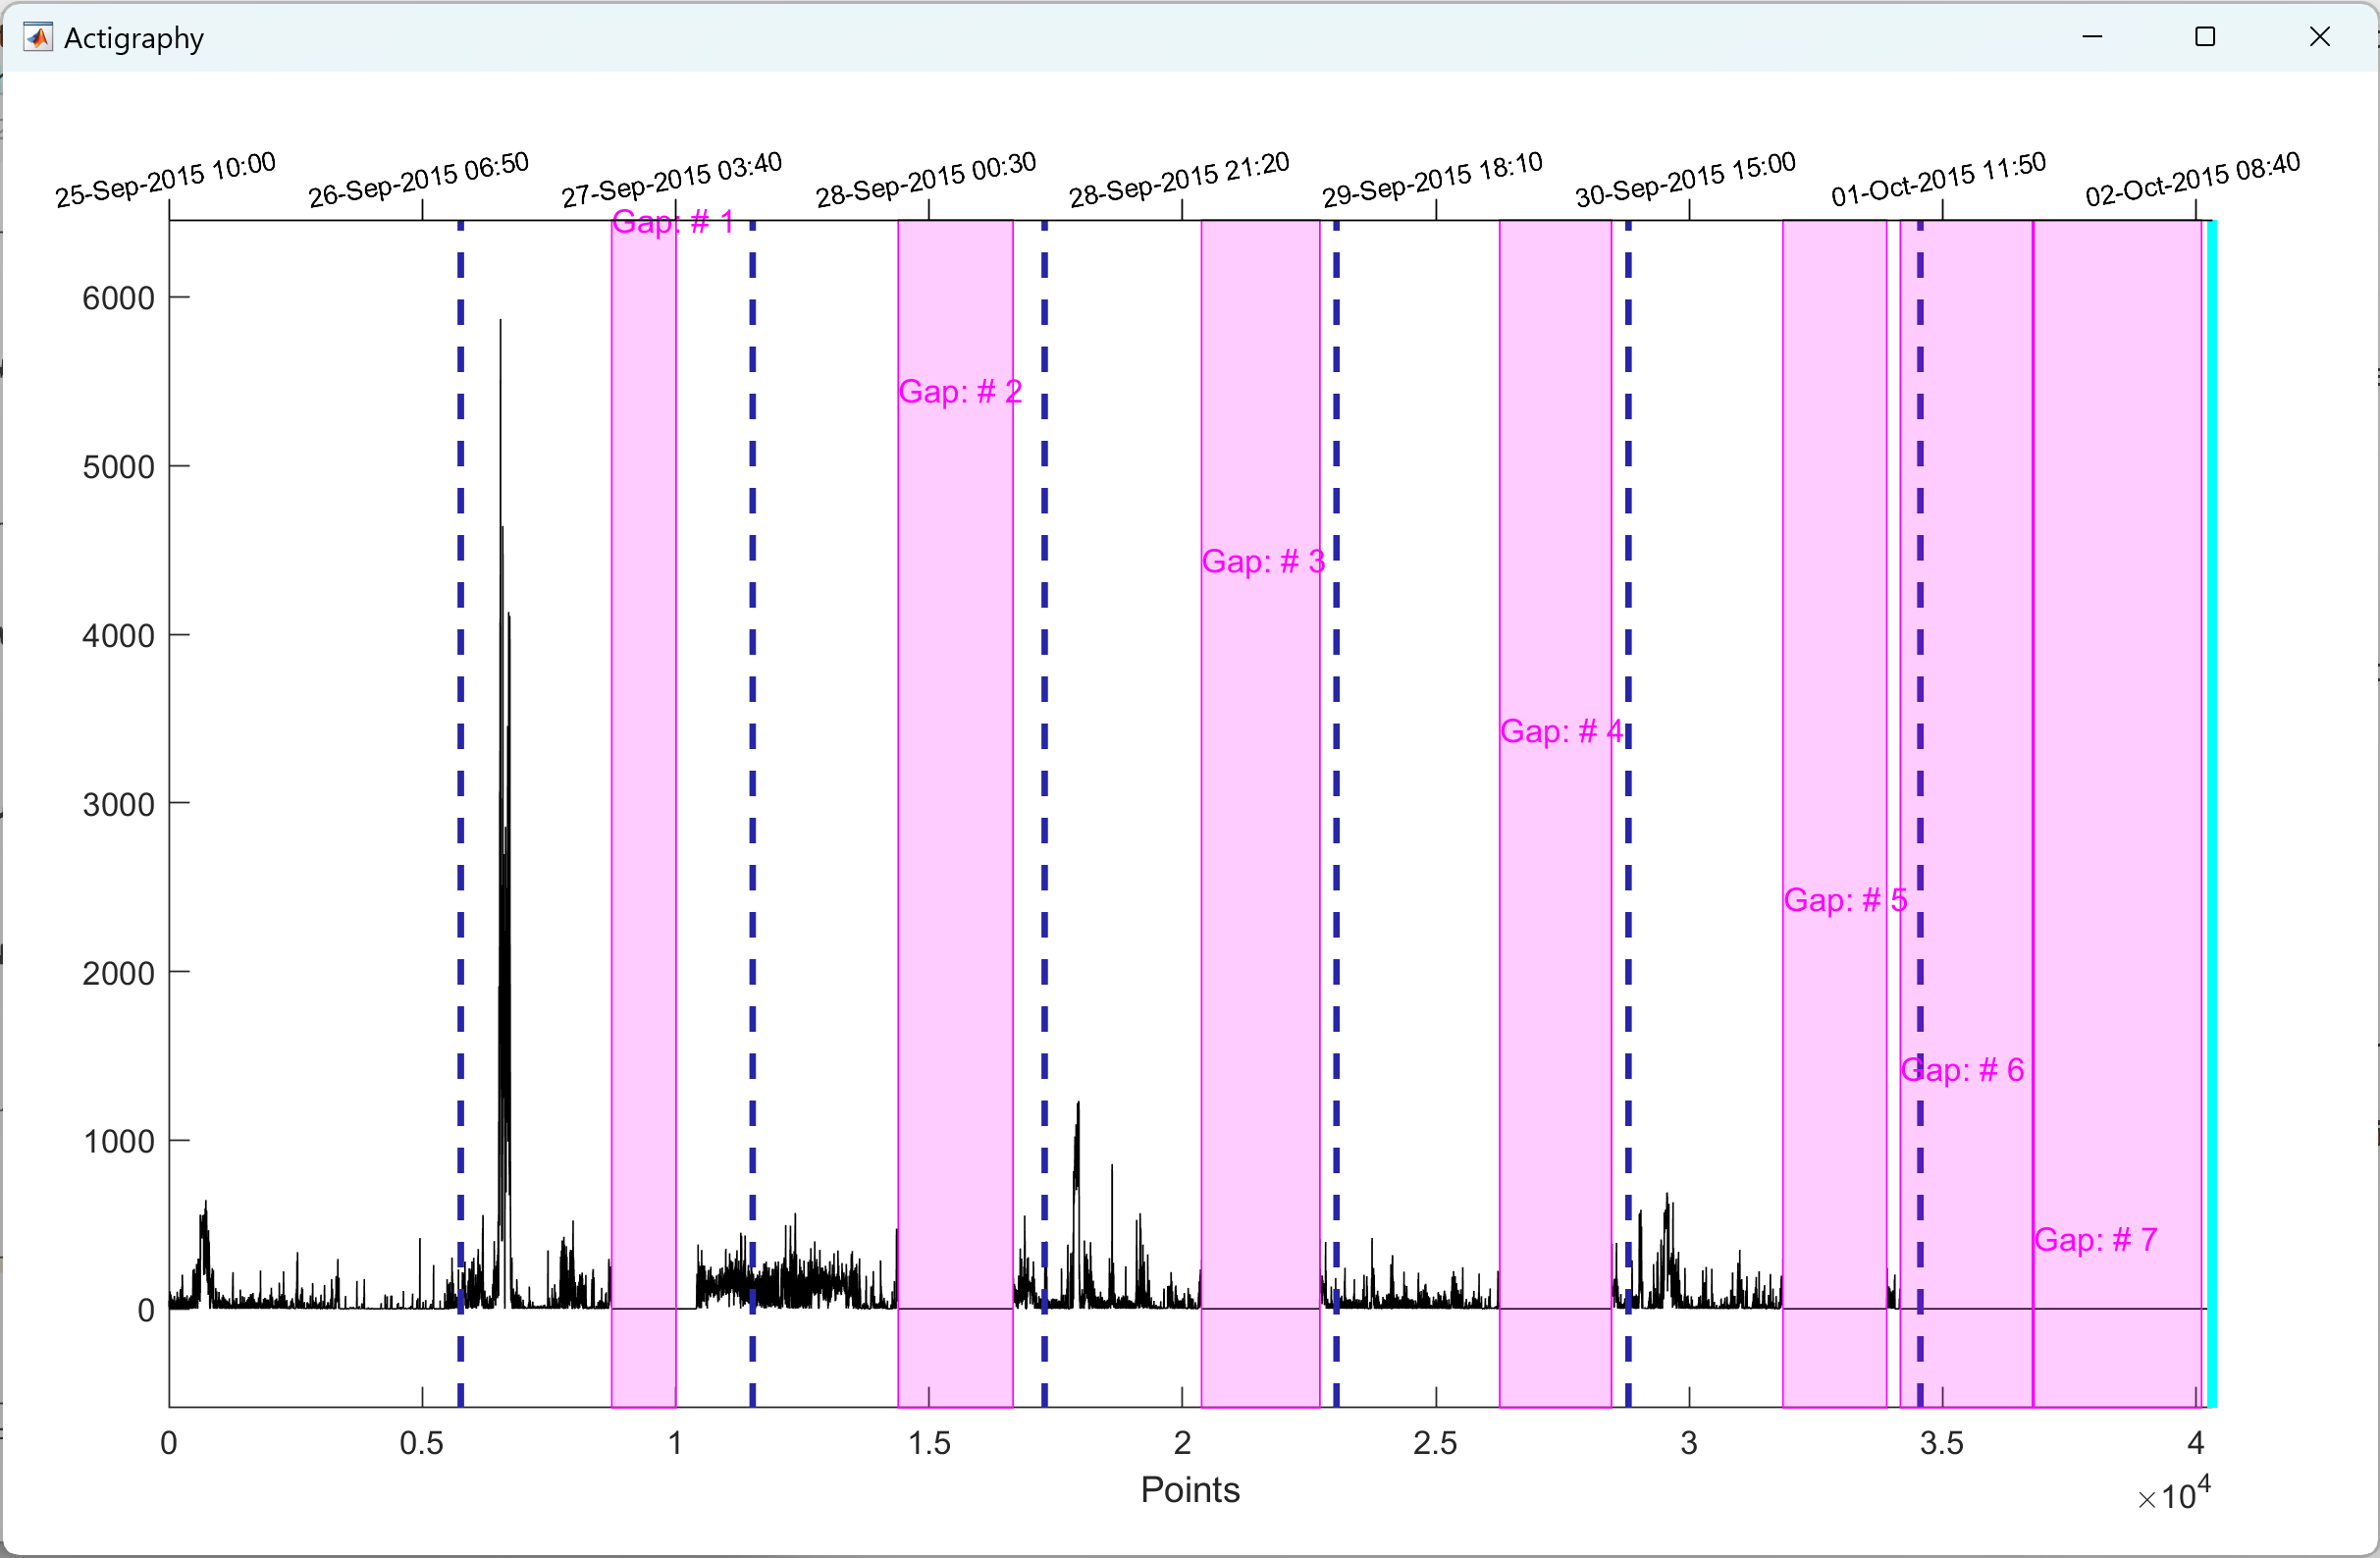
Quality control for actigraphy. Gaps are highlighed in both ways of actigraphy visualization. Credit © Peng Li, Ph.D.
Circadian rhythmicity analysis
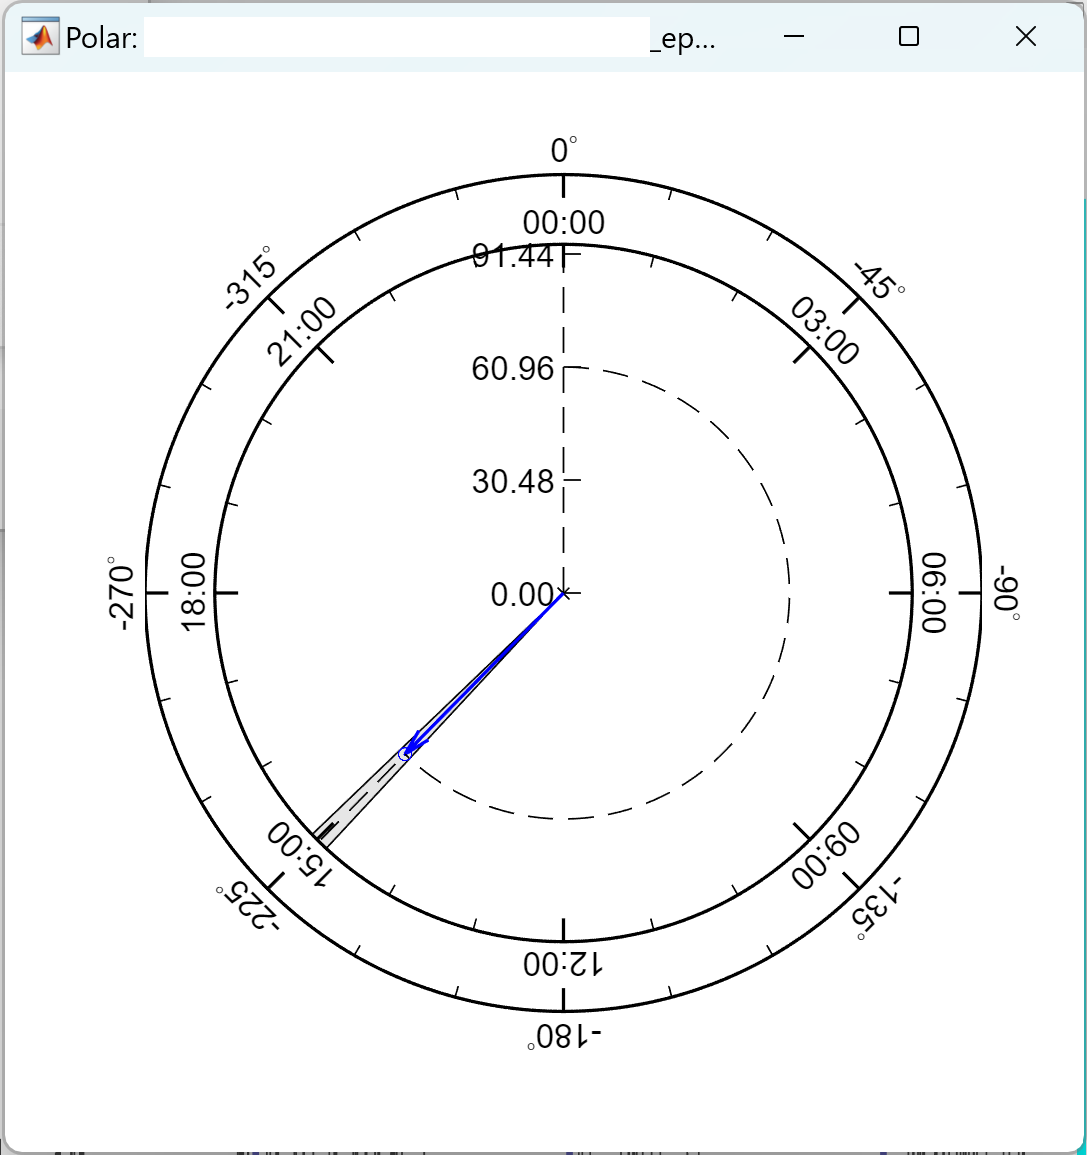
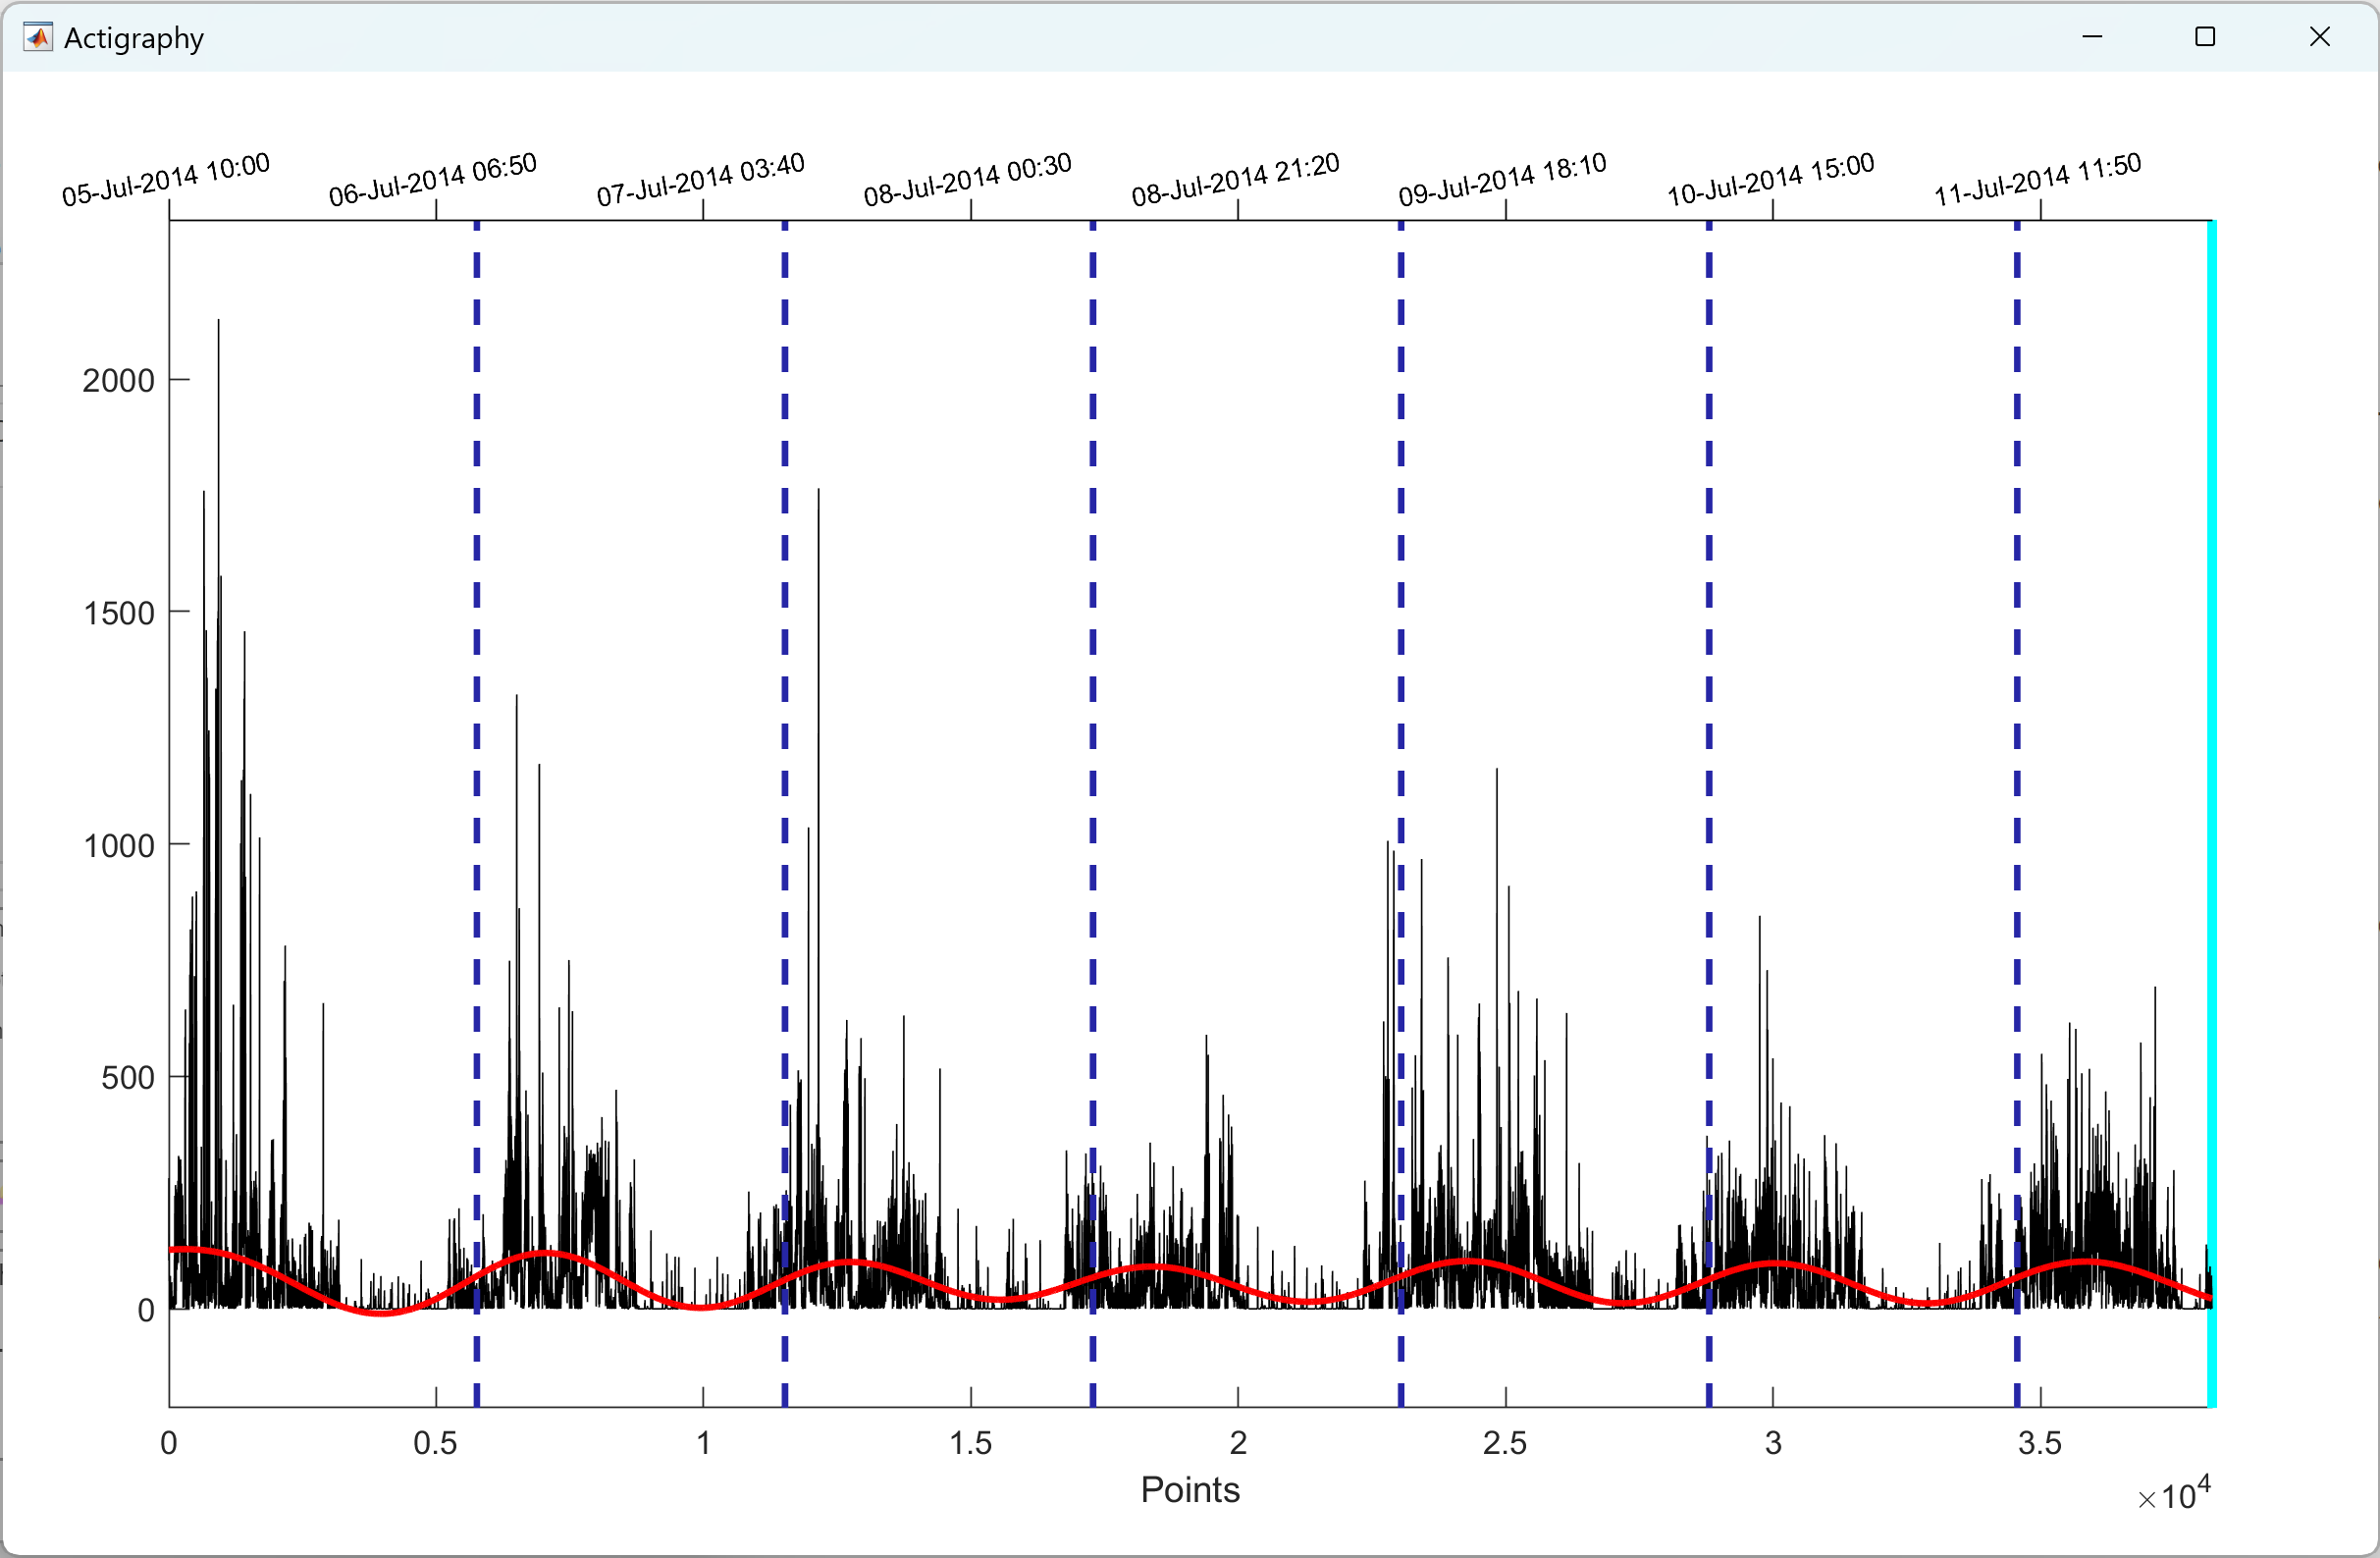
Circadain rest-activity rhythms analysis. Upper panel: the extracted 24-h component is from cosinor analysis. Middle panel: the results of cosinor analysis shown on a 24-h clock. Lower panel: the extracted ~24-h component is from empirical mode decomposition. Credit © Peng Li, Ph.D.
Sleep detection
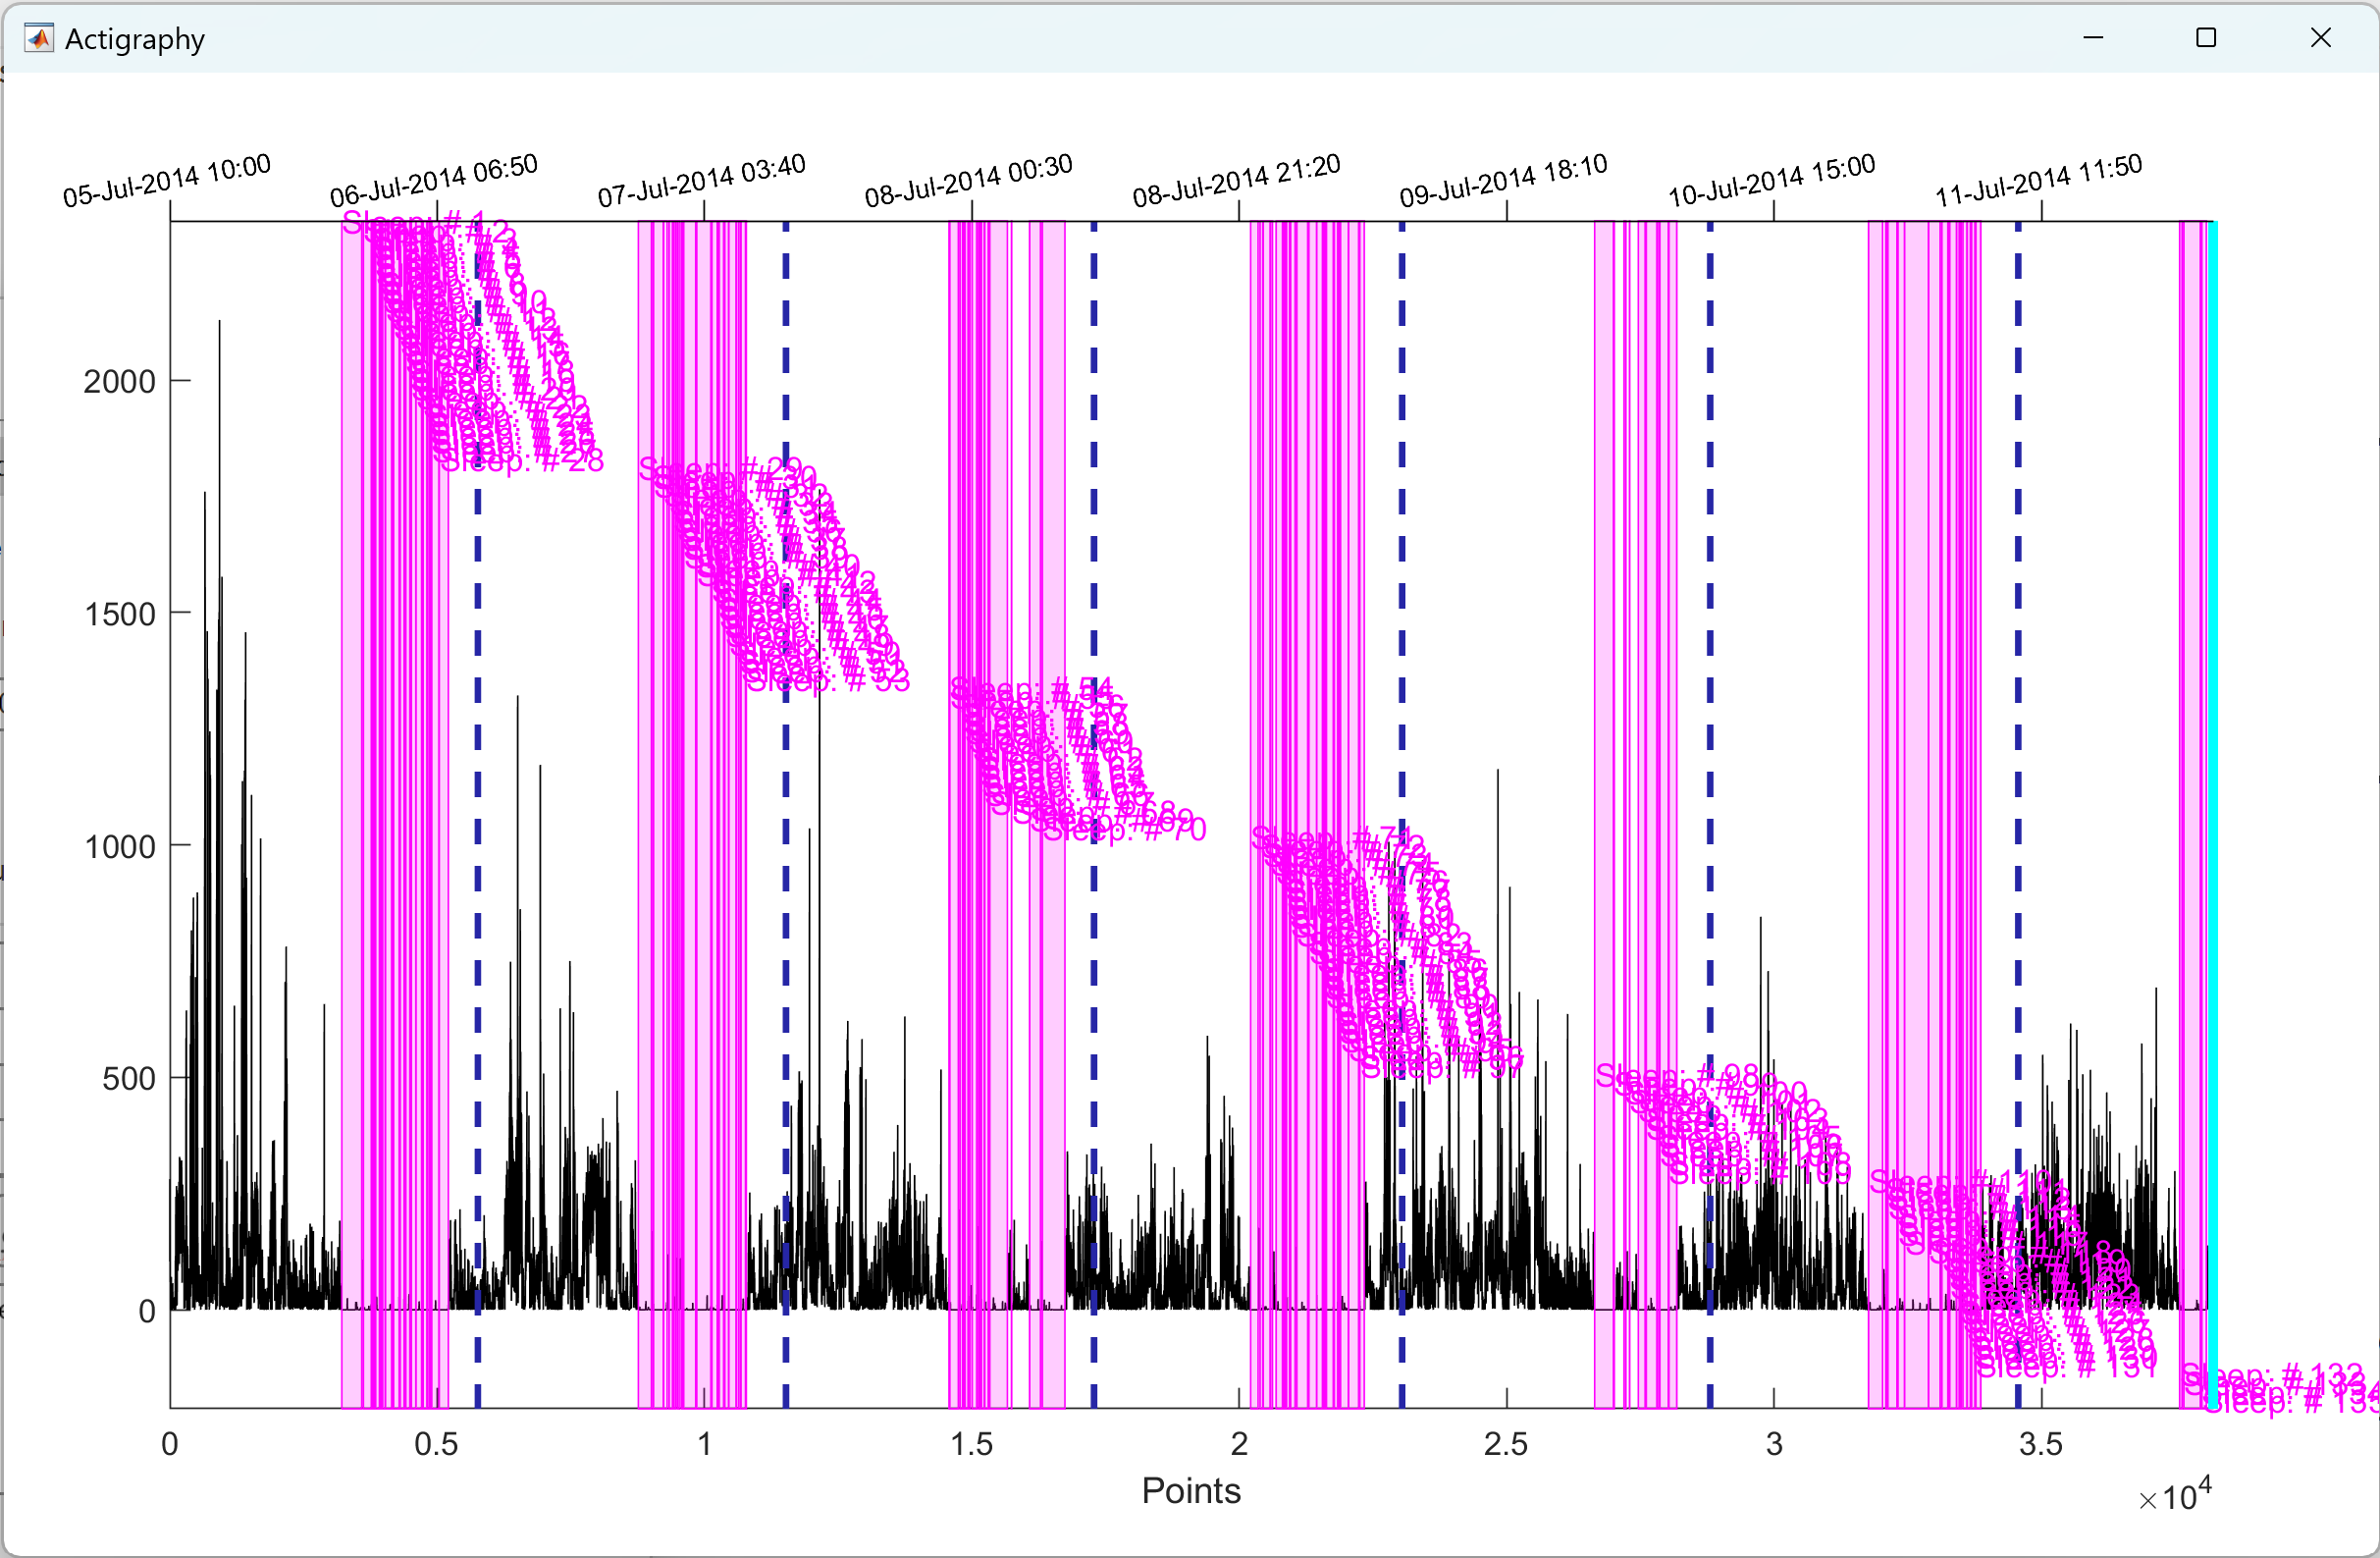
Sleep epoch identification from actigraphy. Credit © Peng Li, Ph.D.
Detrended fluctuation analysis
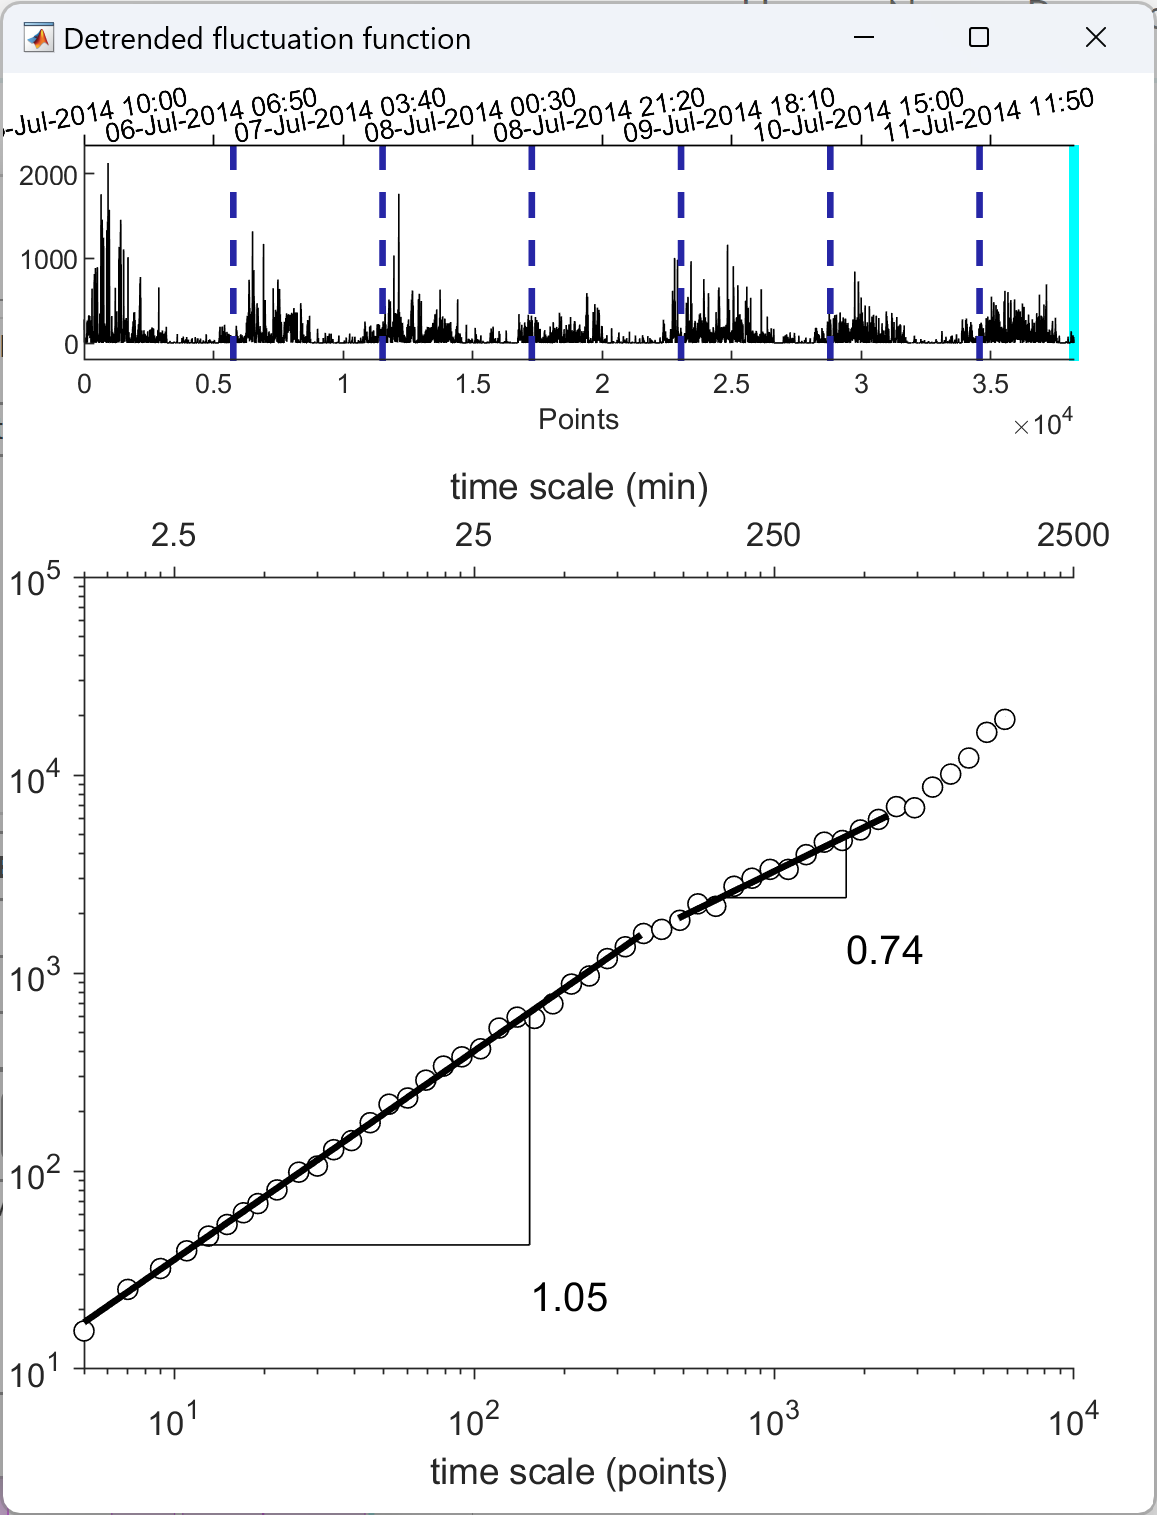
Detrended fluctuation analysis. Credit © Peng Li, Ph.D.
Fun facts—The history of ezActi3
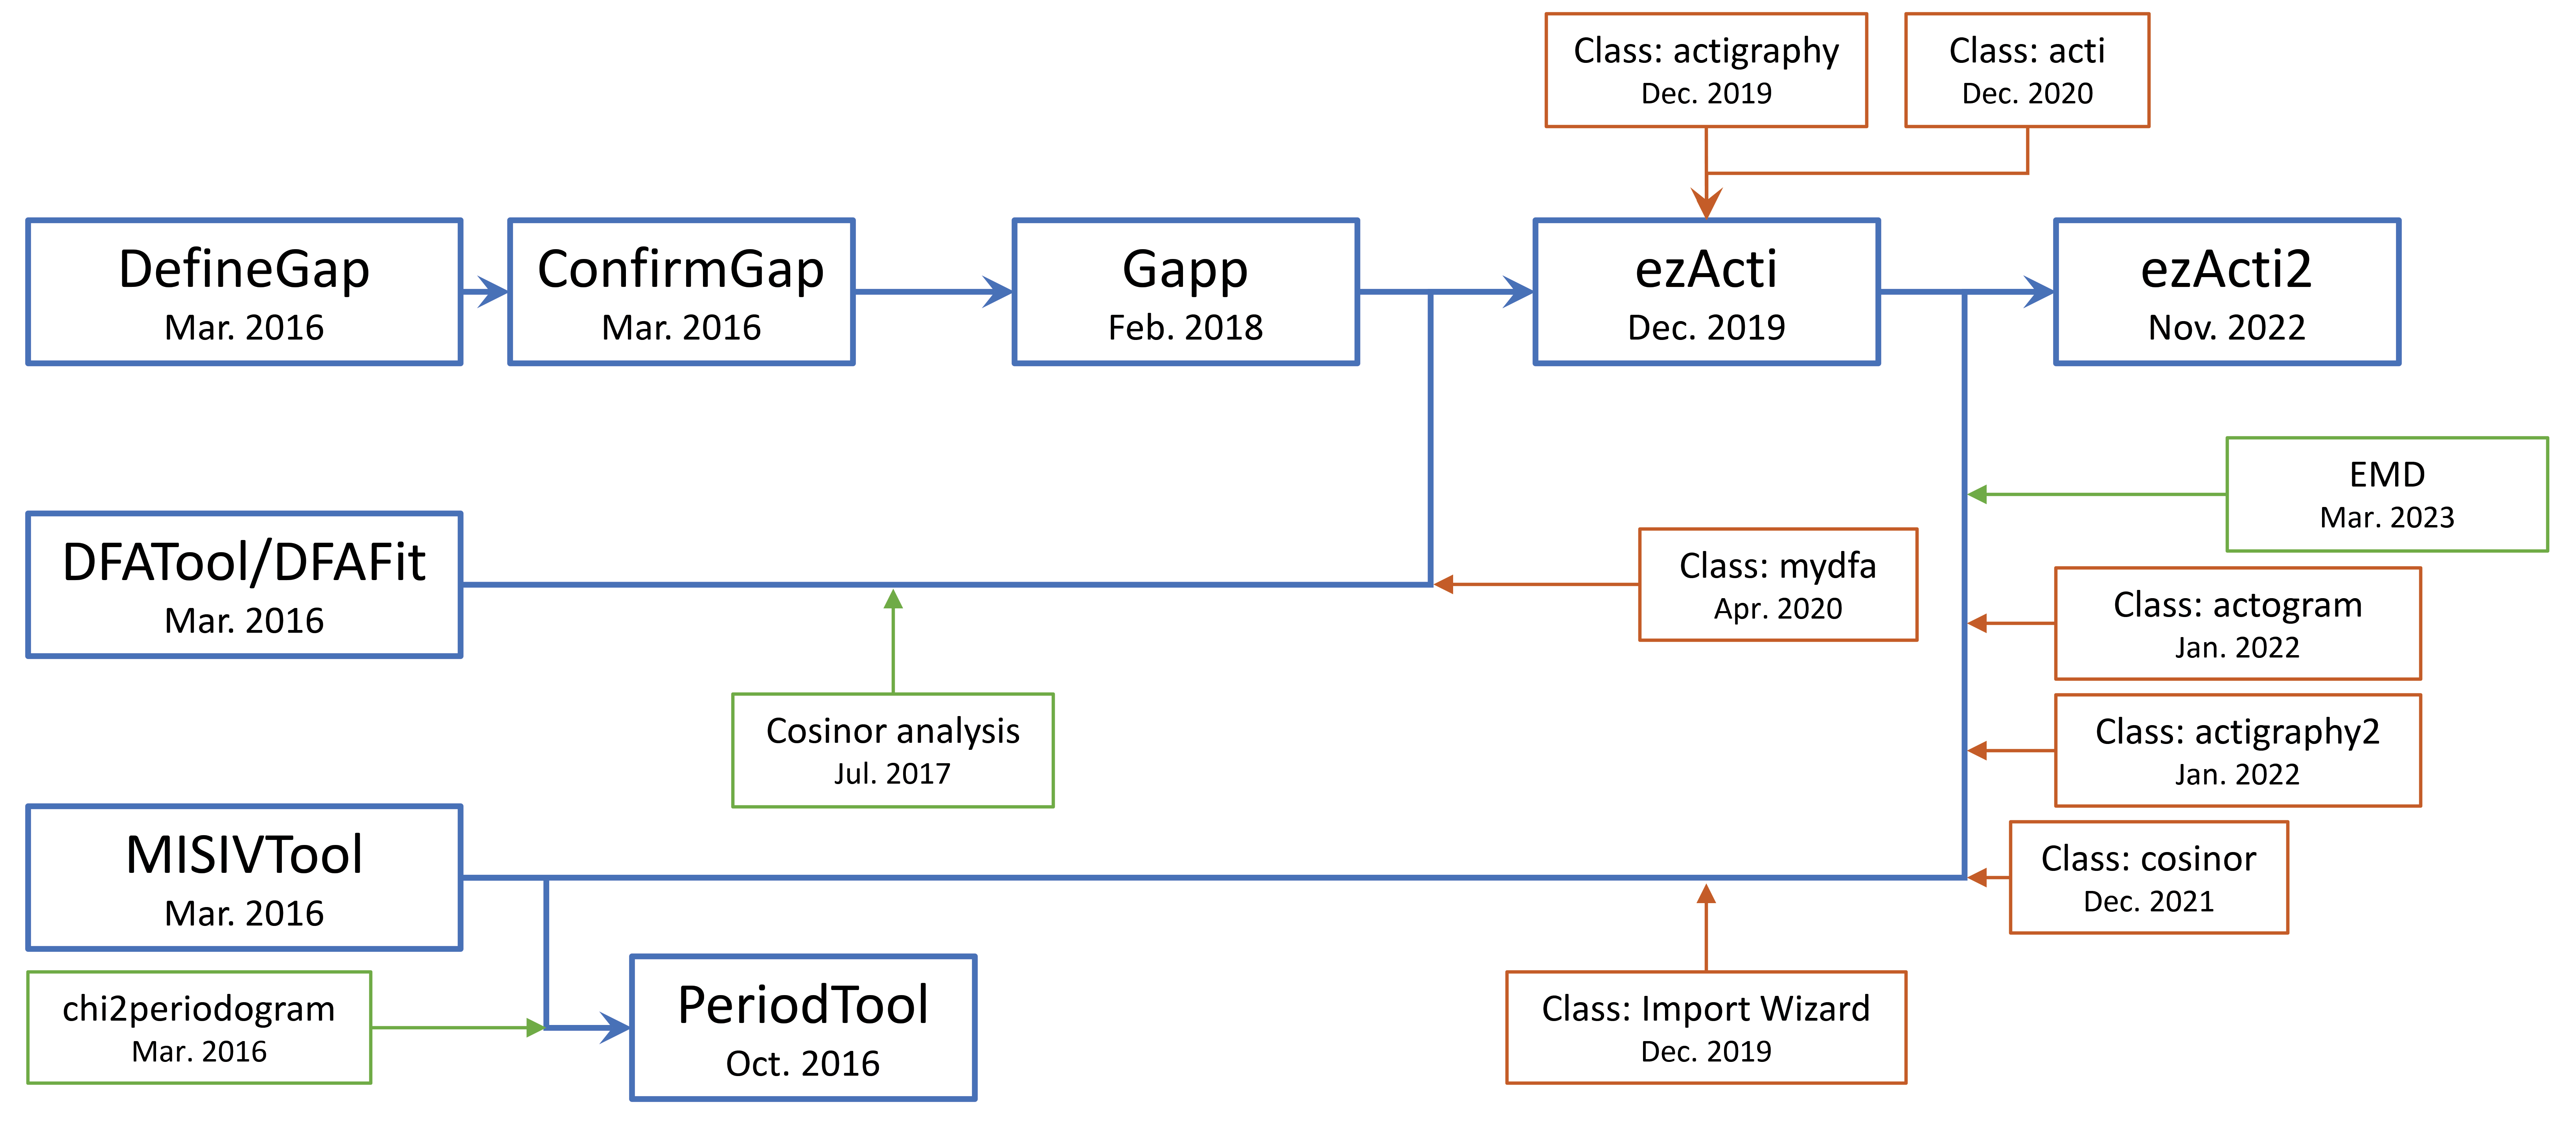
Fun facts—How ezActi2 evolves from its original version. Credit © Peng Li, Ph.D.
I have been thinking of streamlining the actigraphy analysis since early 2016 when he started working on a project that involved more than 6,000 actigraphy recordings.
Initially, two research assistants were working with me helping with the quality control of these recordings. To facilitate a “semi-automatic” process, a MATLAB©-based simple App called DefineGap was born.
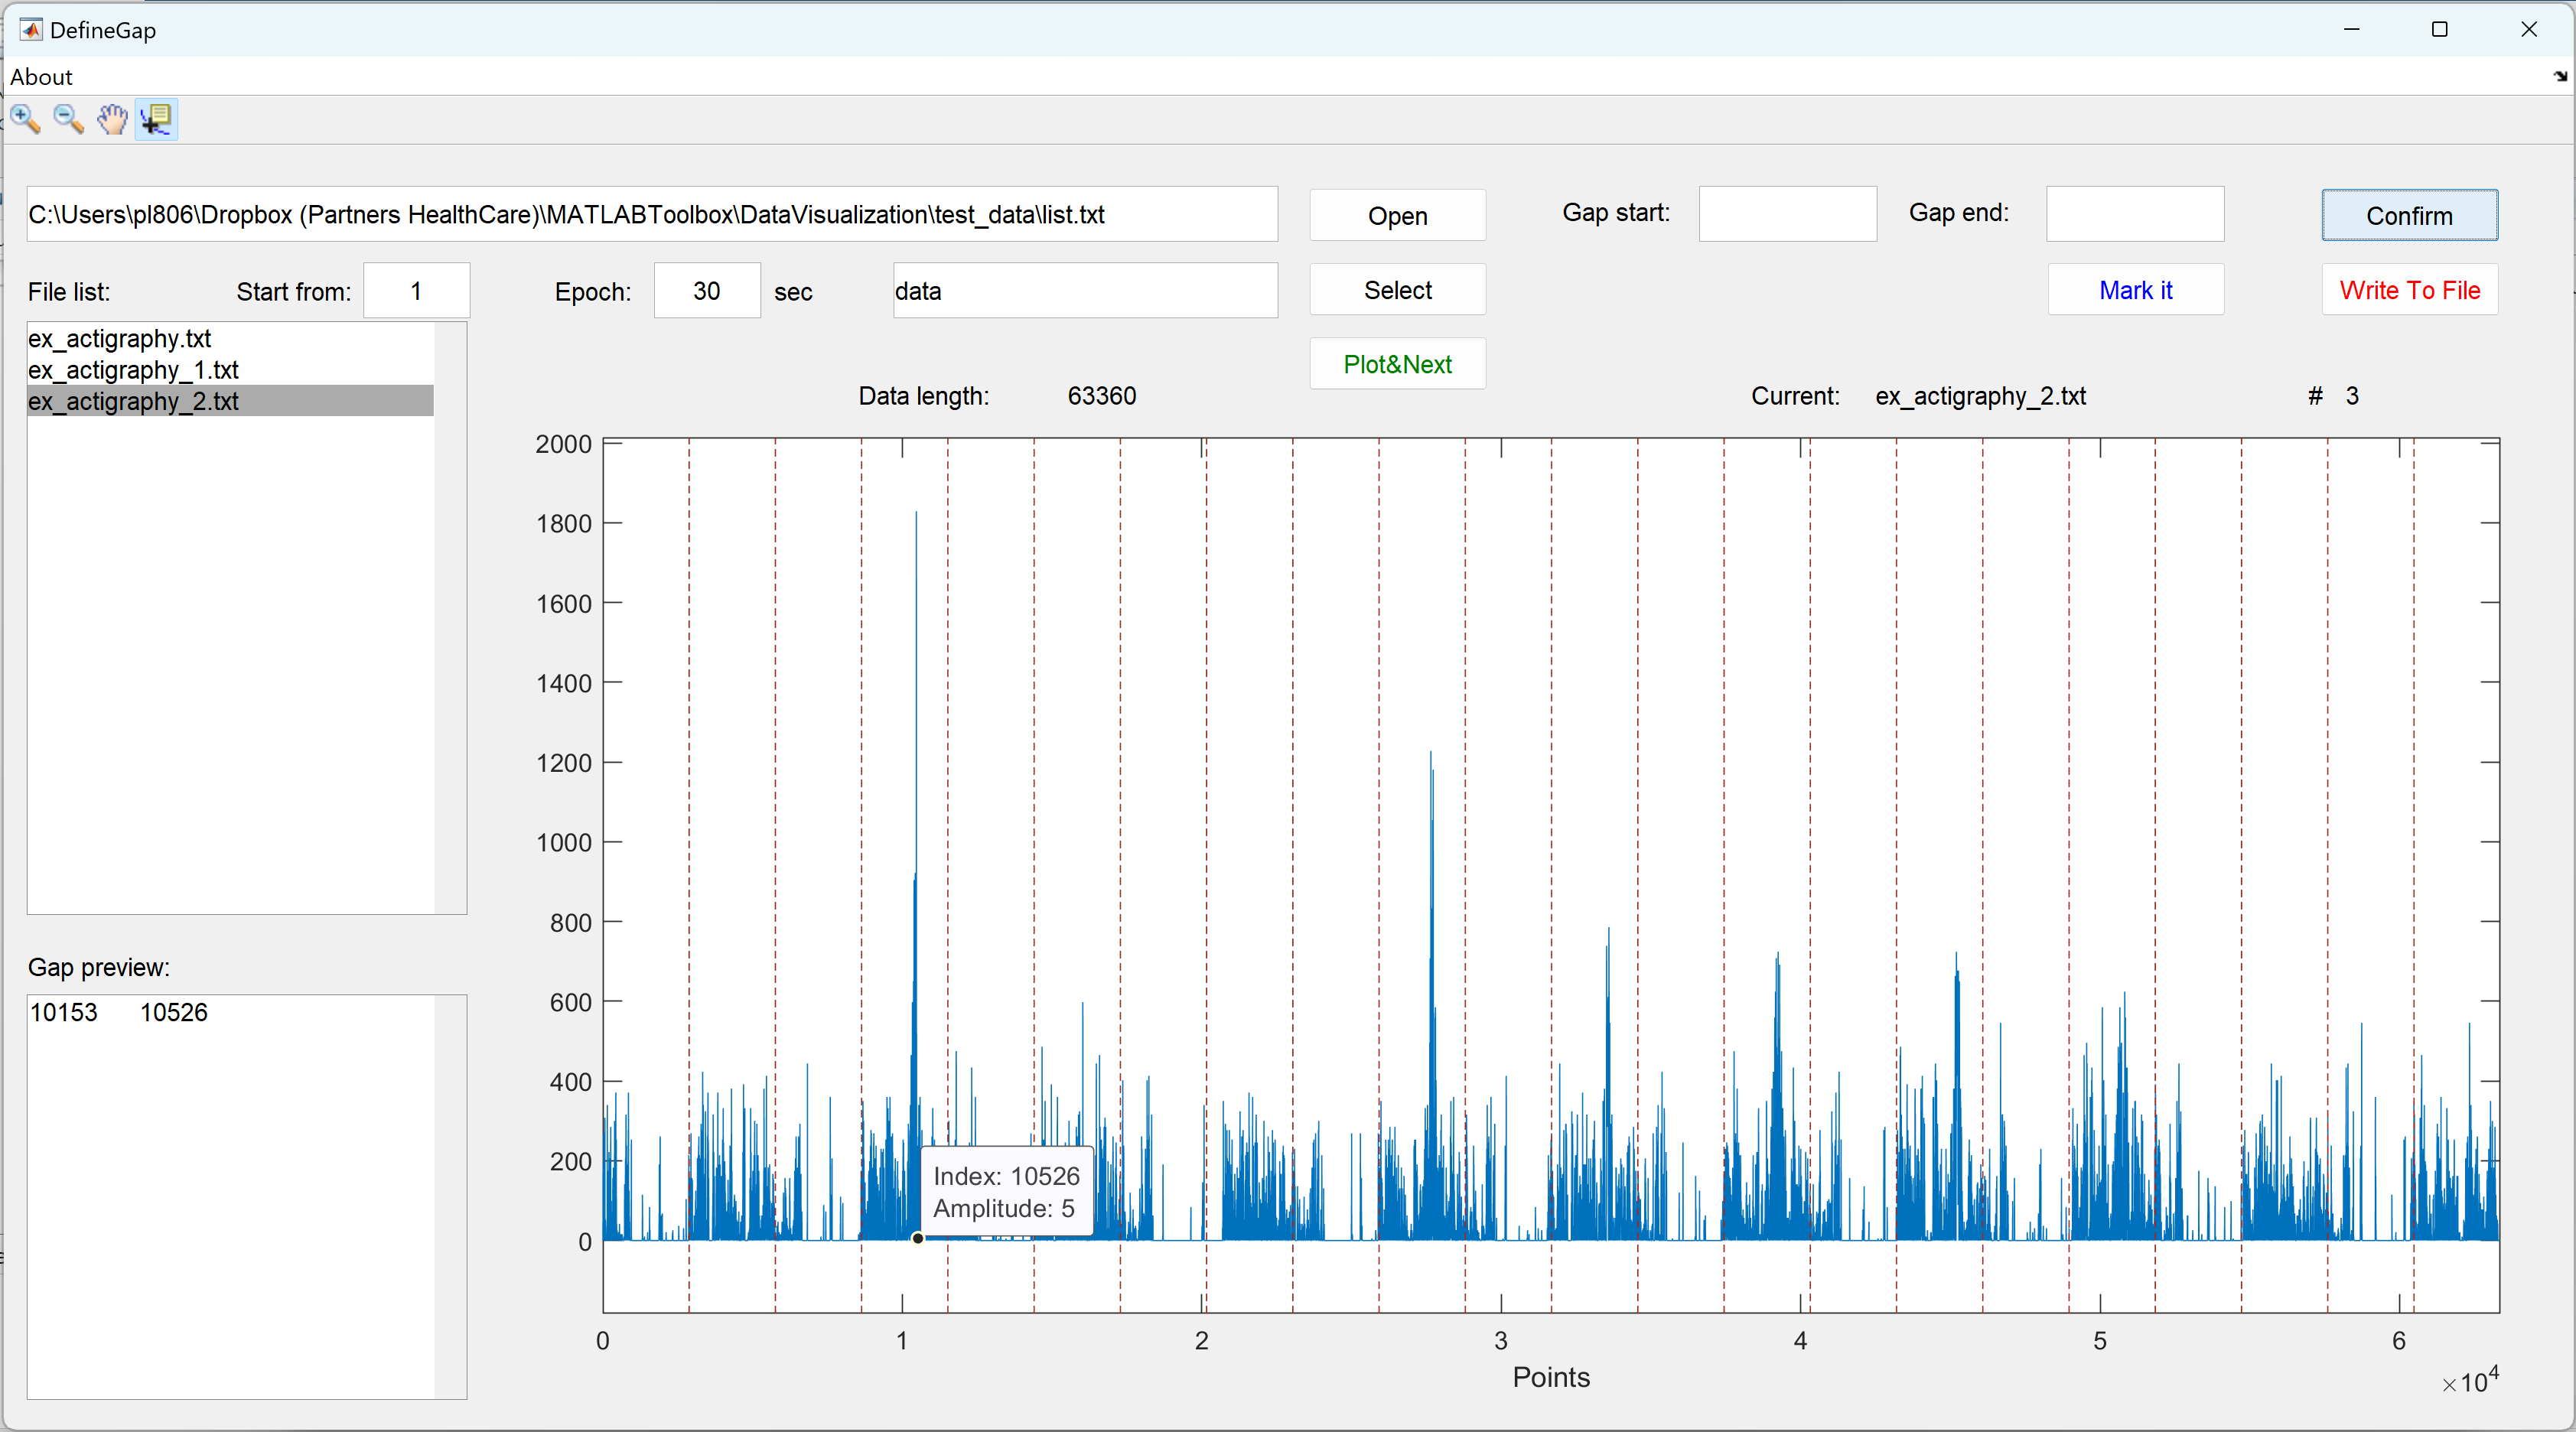
The user interface of DefineGap. Credit © Peng Li, Ph.D. 2016
The App simply helps the research assistants and myself visualize the signal and document the “gap” if we ever identify any. Some user friendly tools have been implemented in order to zoom in specific areas and to show the data points using tooltips.
Almost at the same time, the research group started performing detrended fluctuation analysis (check this publication and this article for some results from this project). The two research assistants clearly preferred a small tool with a user interface instead of running through command lines. A DFATool App paired with a DFAFit App were thus developed to facilitate this process.
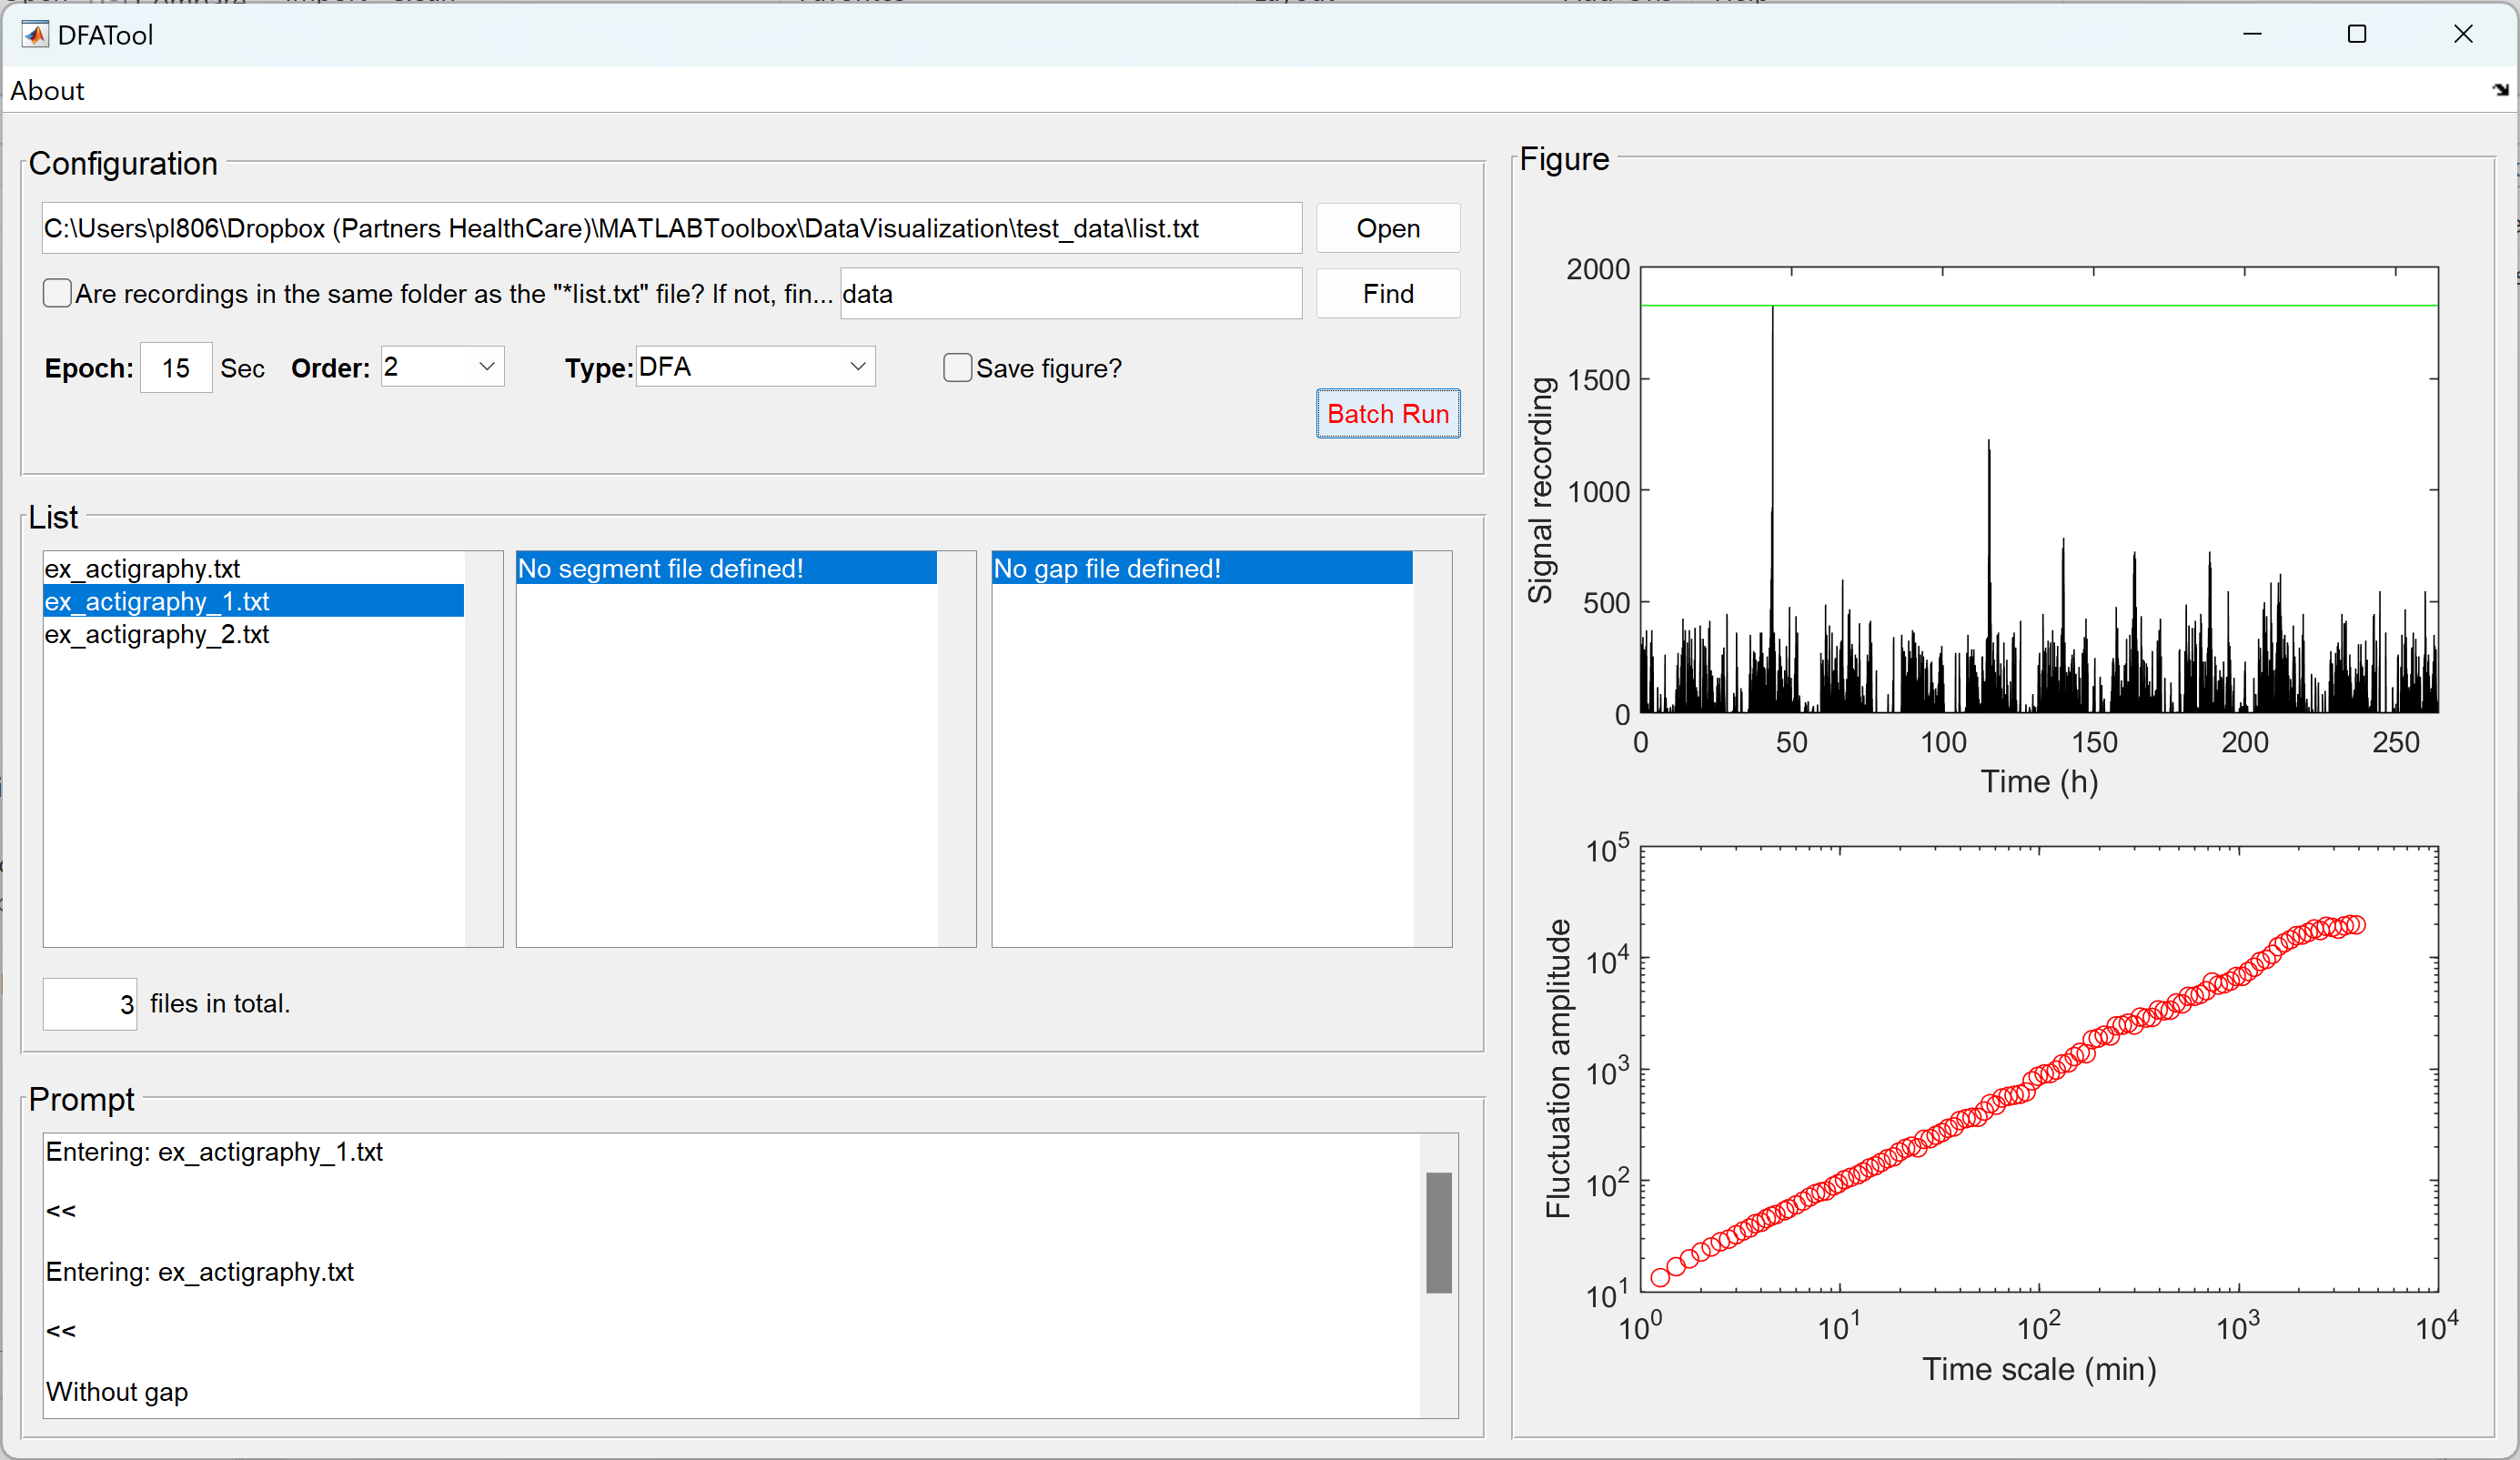
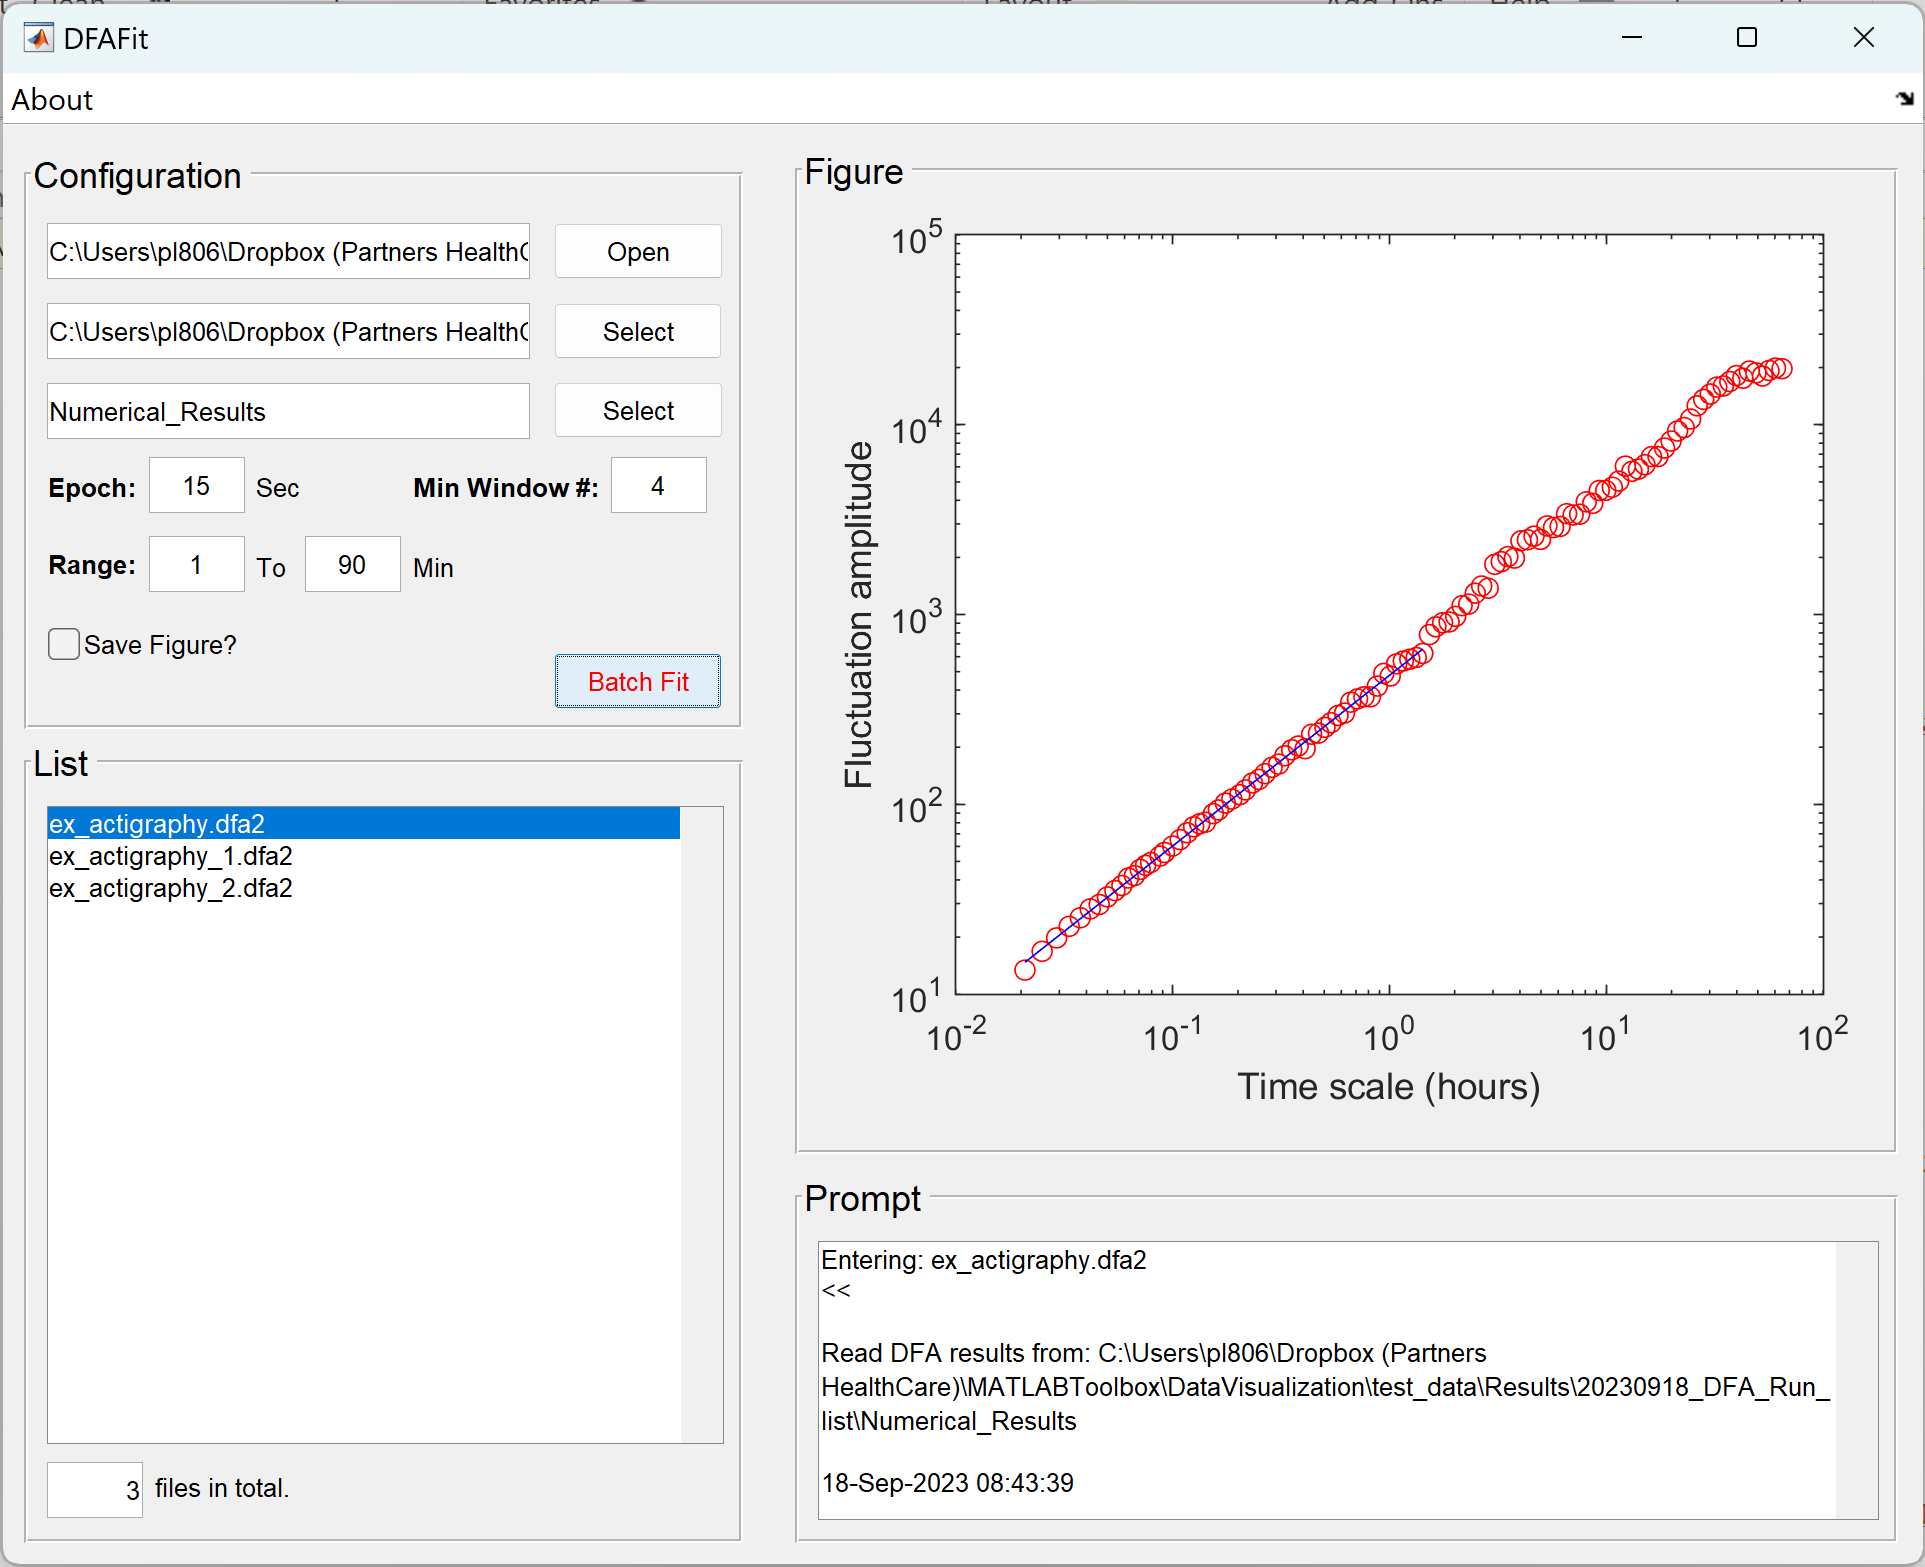
The user interfaces of the paired App—DFATool and DFAFit. Credit © Peng Li, Ph.D. 2016-2019
Similarly, to facilitate the process of performing some nonparametric circadian rest-activity rhythms analysis, I also wrote a small tool called MISIVTool. As it was named, the tool performs IS (stands for interdaily stability) and IV (stands for intradaily variability) analysis on a multiscale (the “M” in the name) basis. Also, to better estimate the actual period (especially for example in animal studies without 12:12 light-dark cycles), a variant of the MISIVTool was made to implement the $\chi$2 periodogram—the PeriodTool.
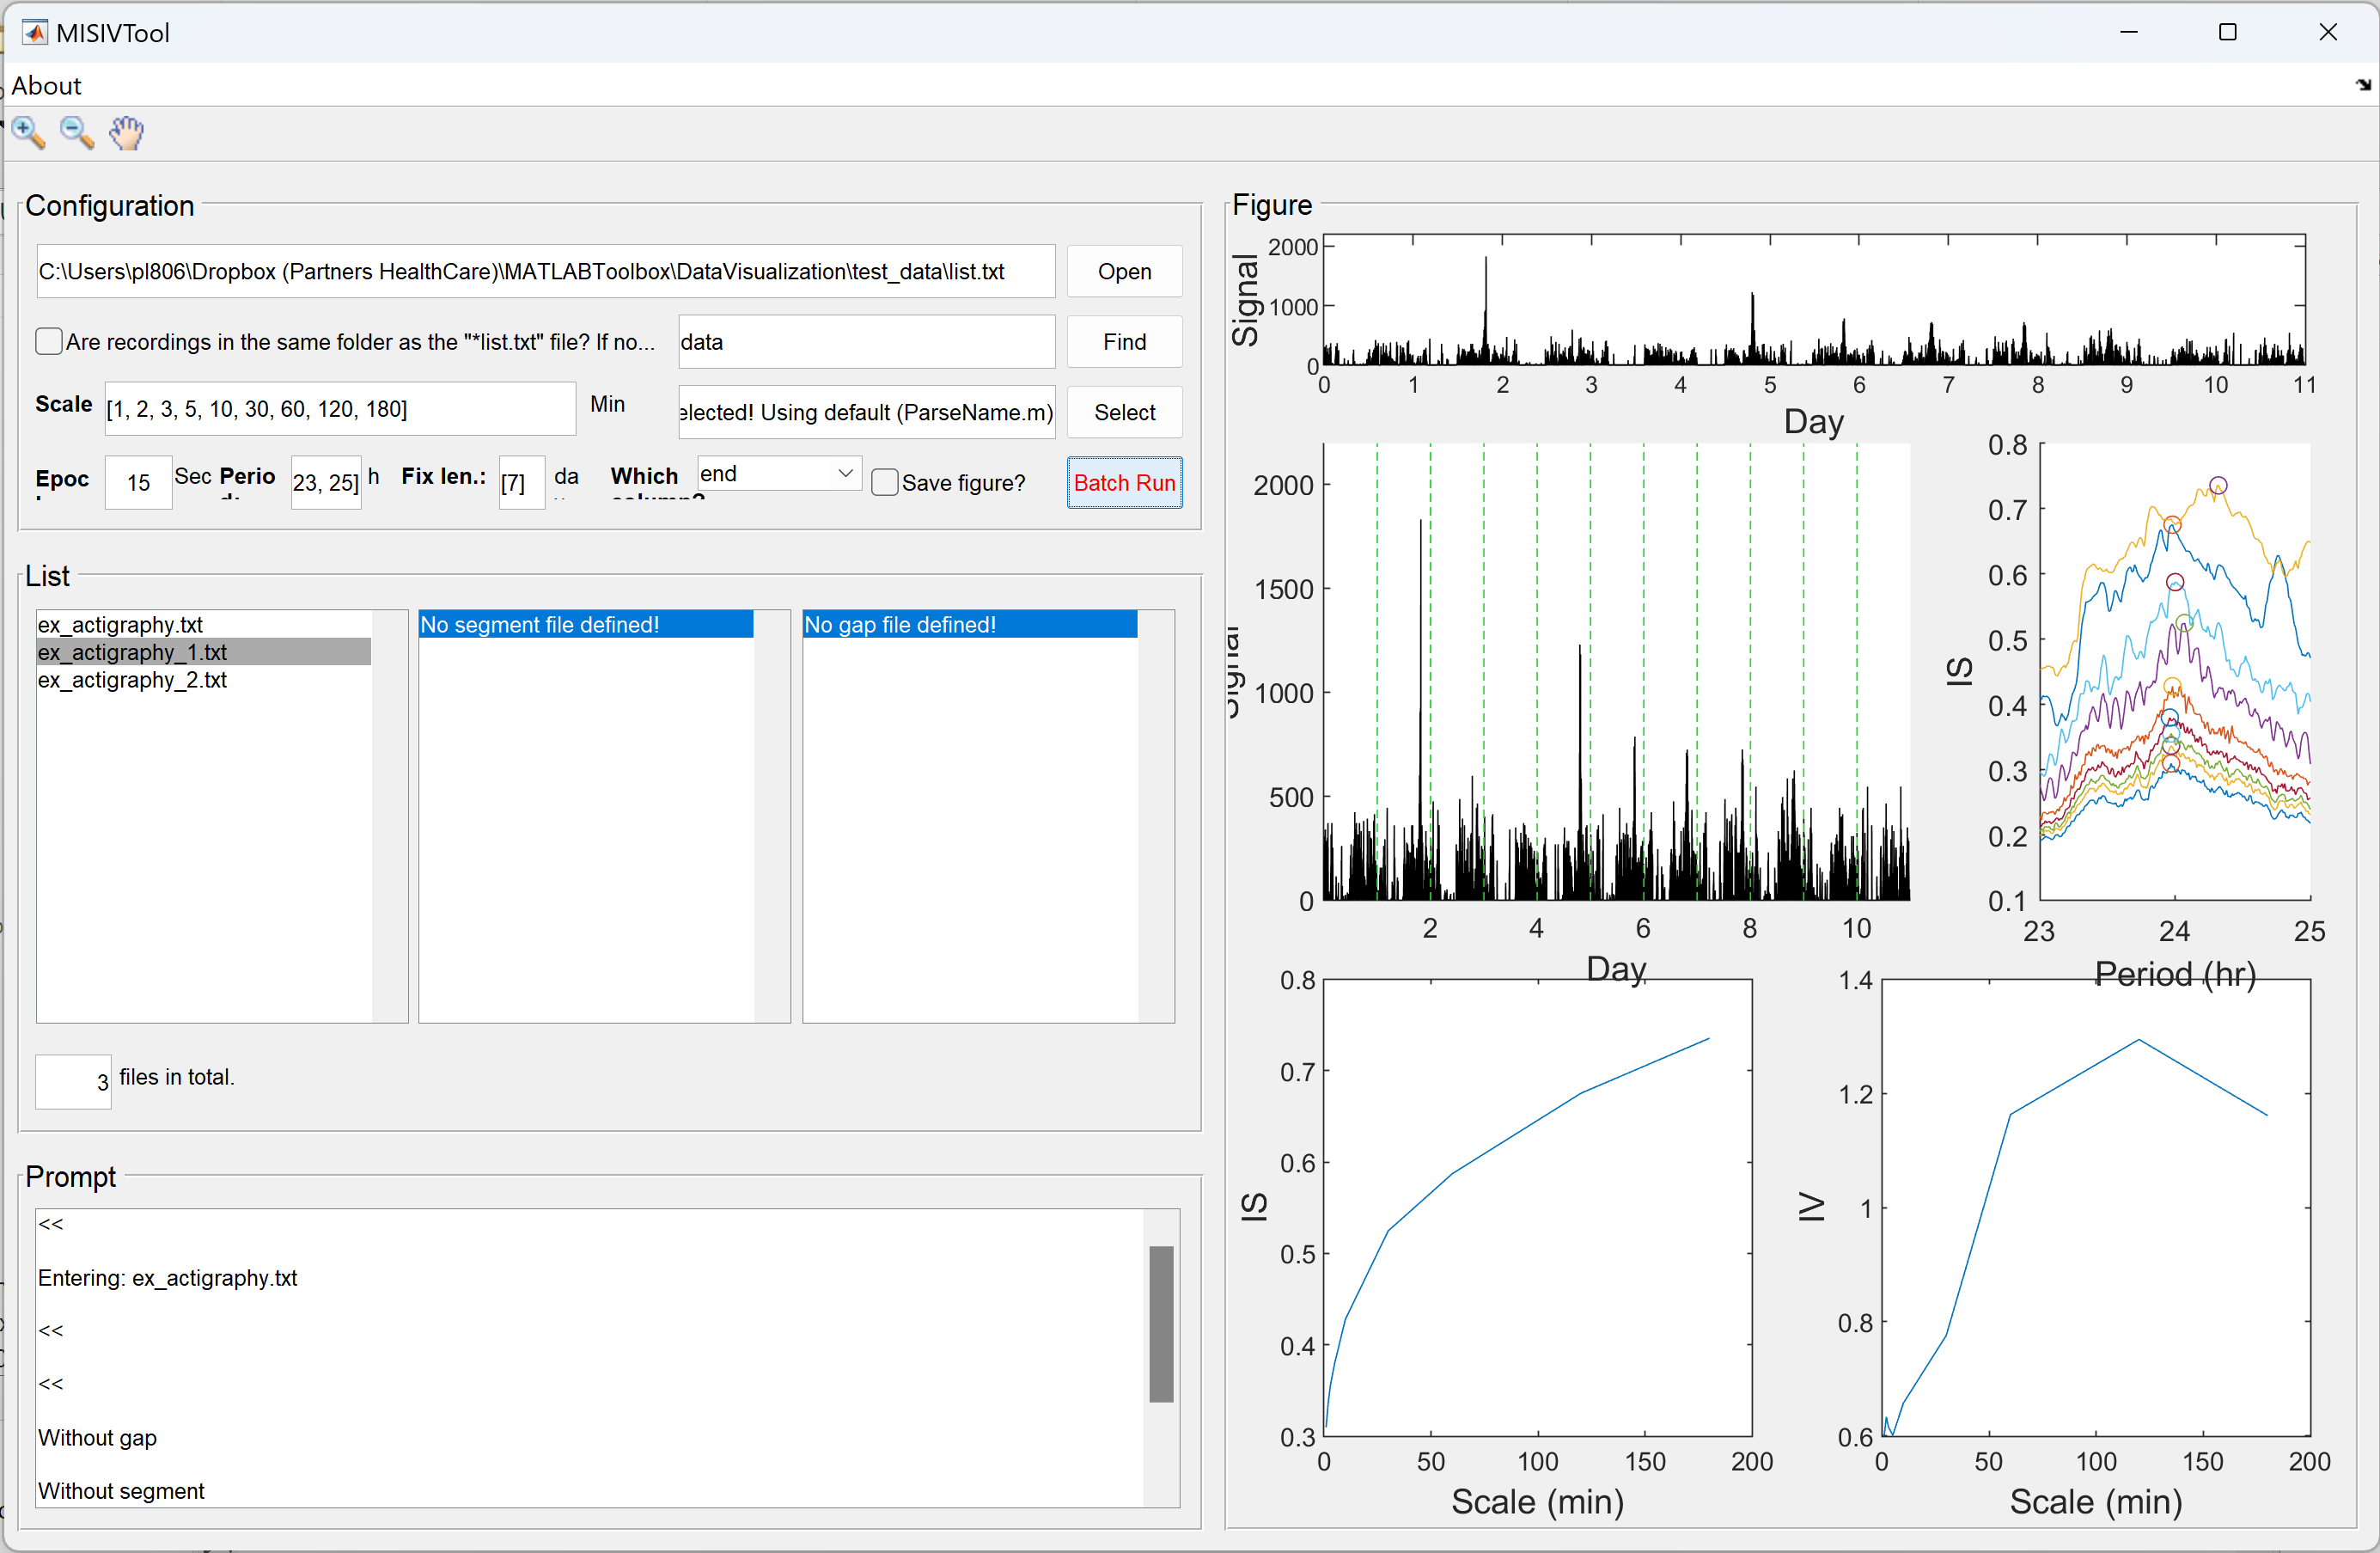
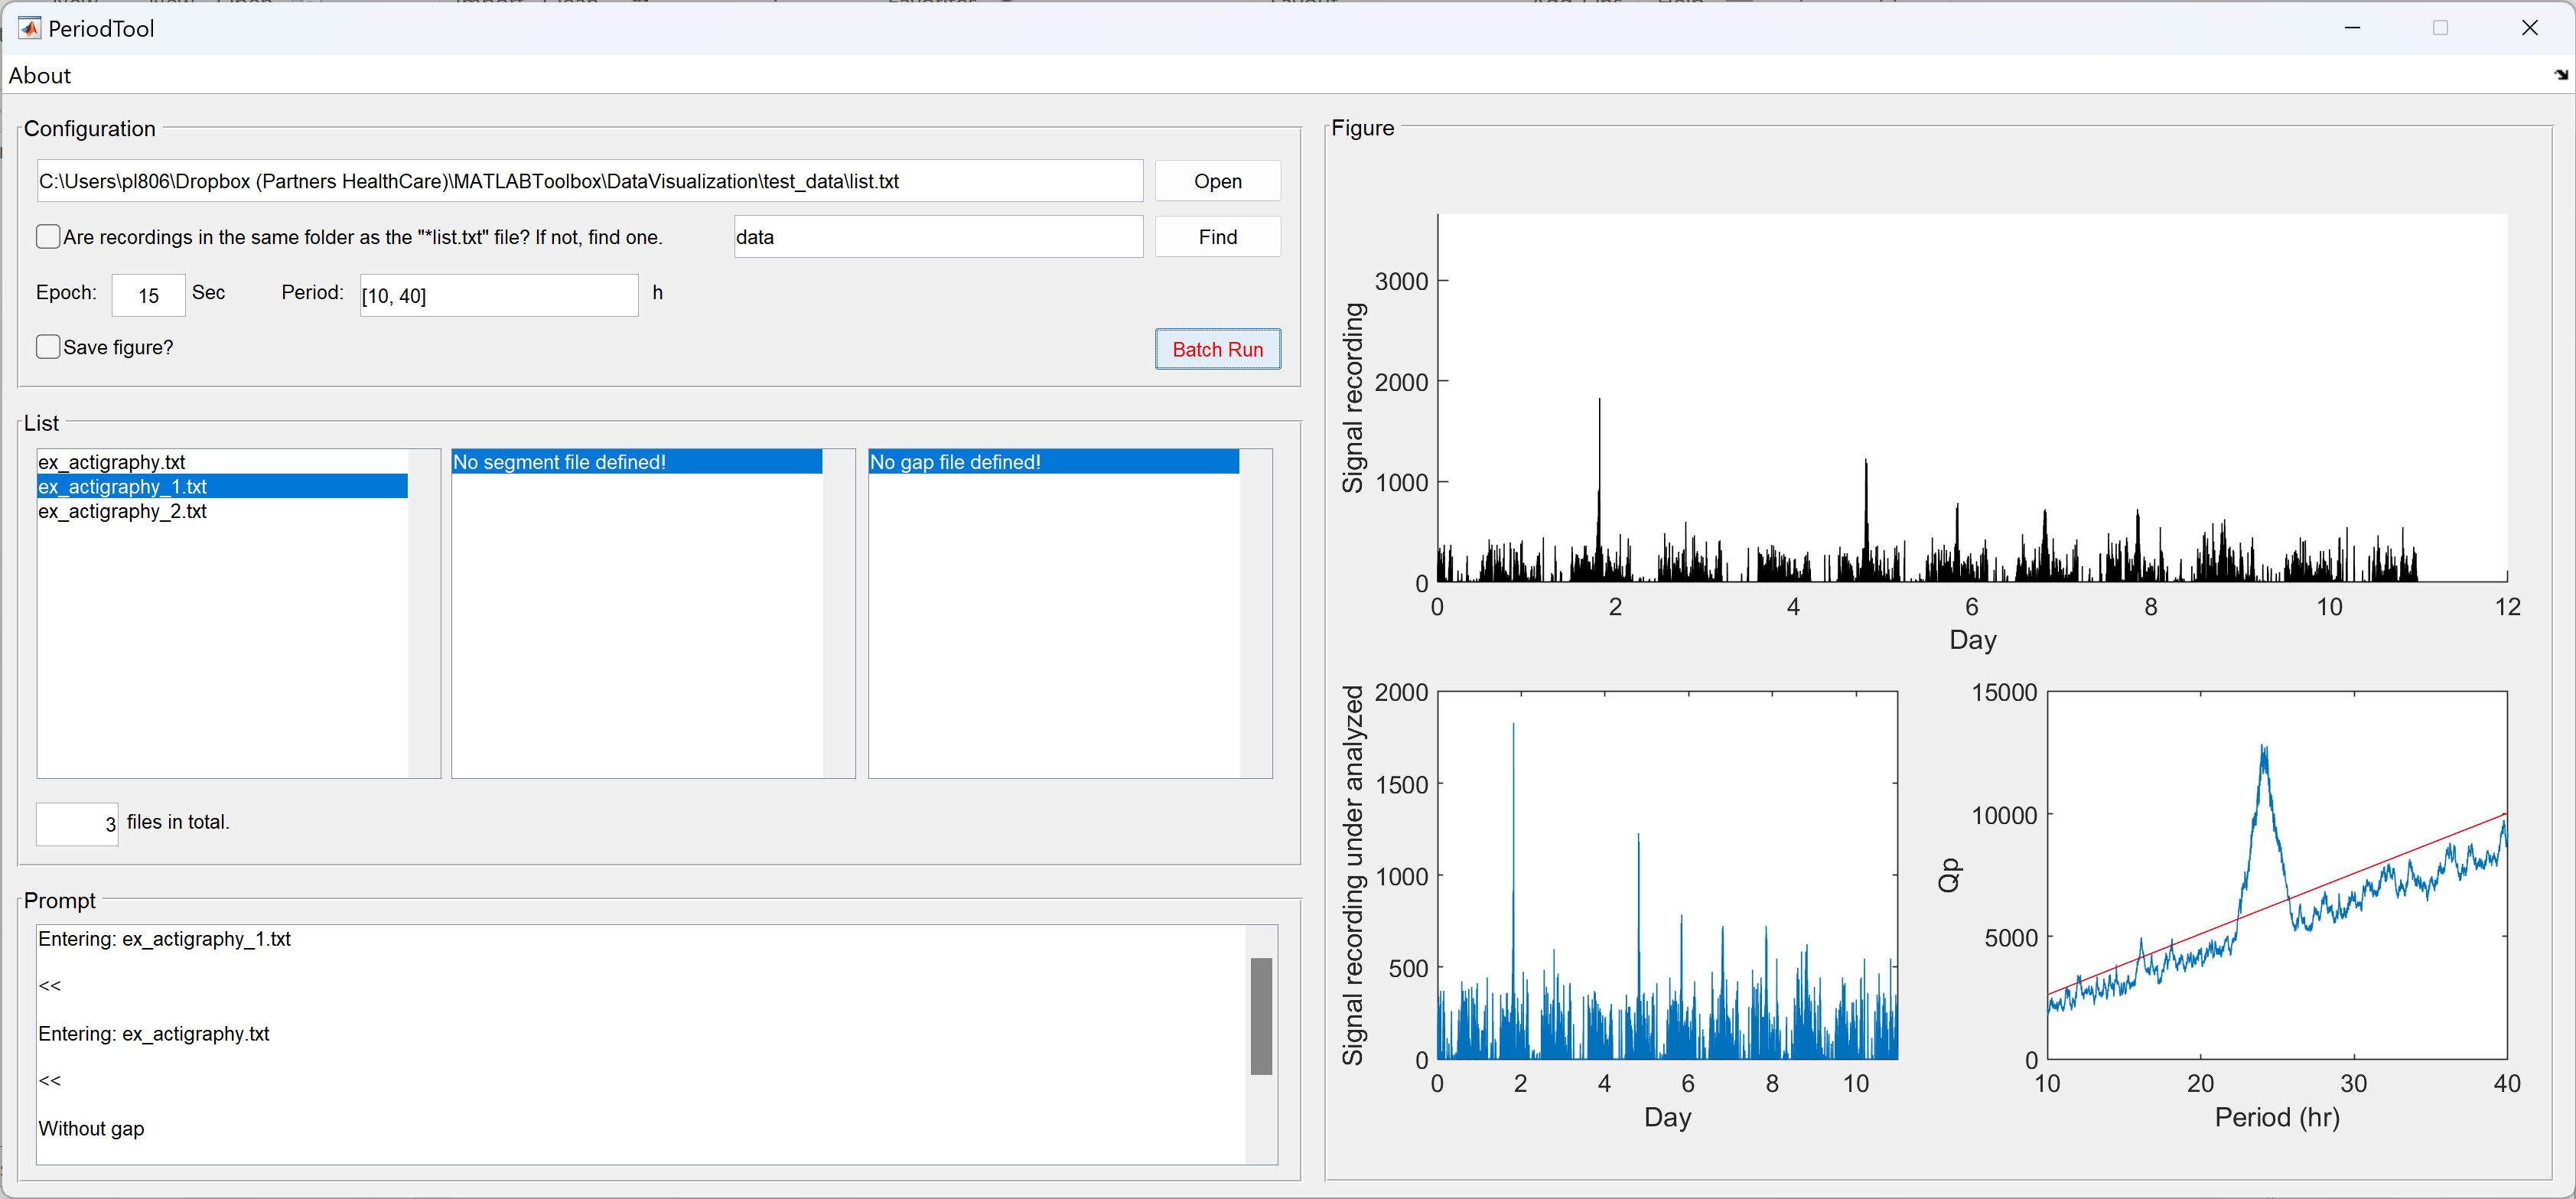
The user interfaces of the MISIVTool and PeriodTool. Credit © Peng Li, Ph.D. 2016-
All of these small tools continue to evolve and being updated separately.
To simplify the story, let’s focus on the timeline of the DefineGap, which soon evolved into its updated version—ConfirmGap. It came with a tabular-formated gap visualizer and also highlights the identified gap areas in the actigraphy. It was also featured with an “advanced option” that facilitate the display of the actual time of the signal (in addition to data points).
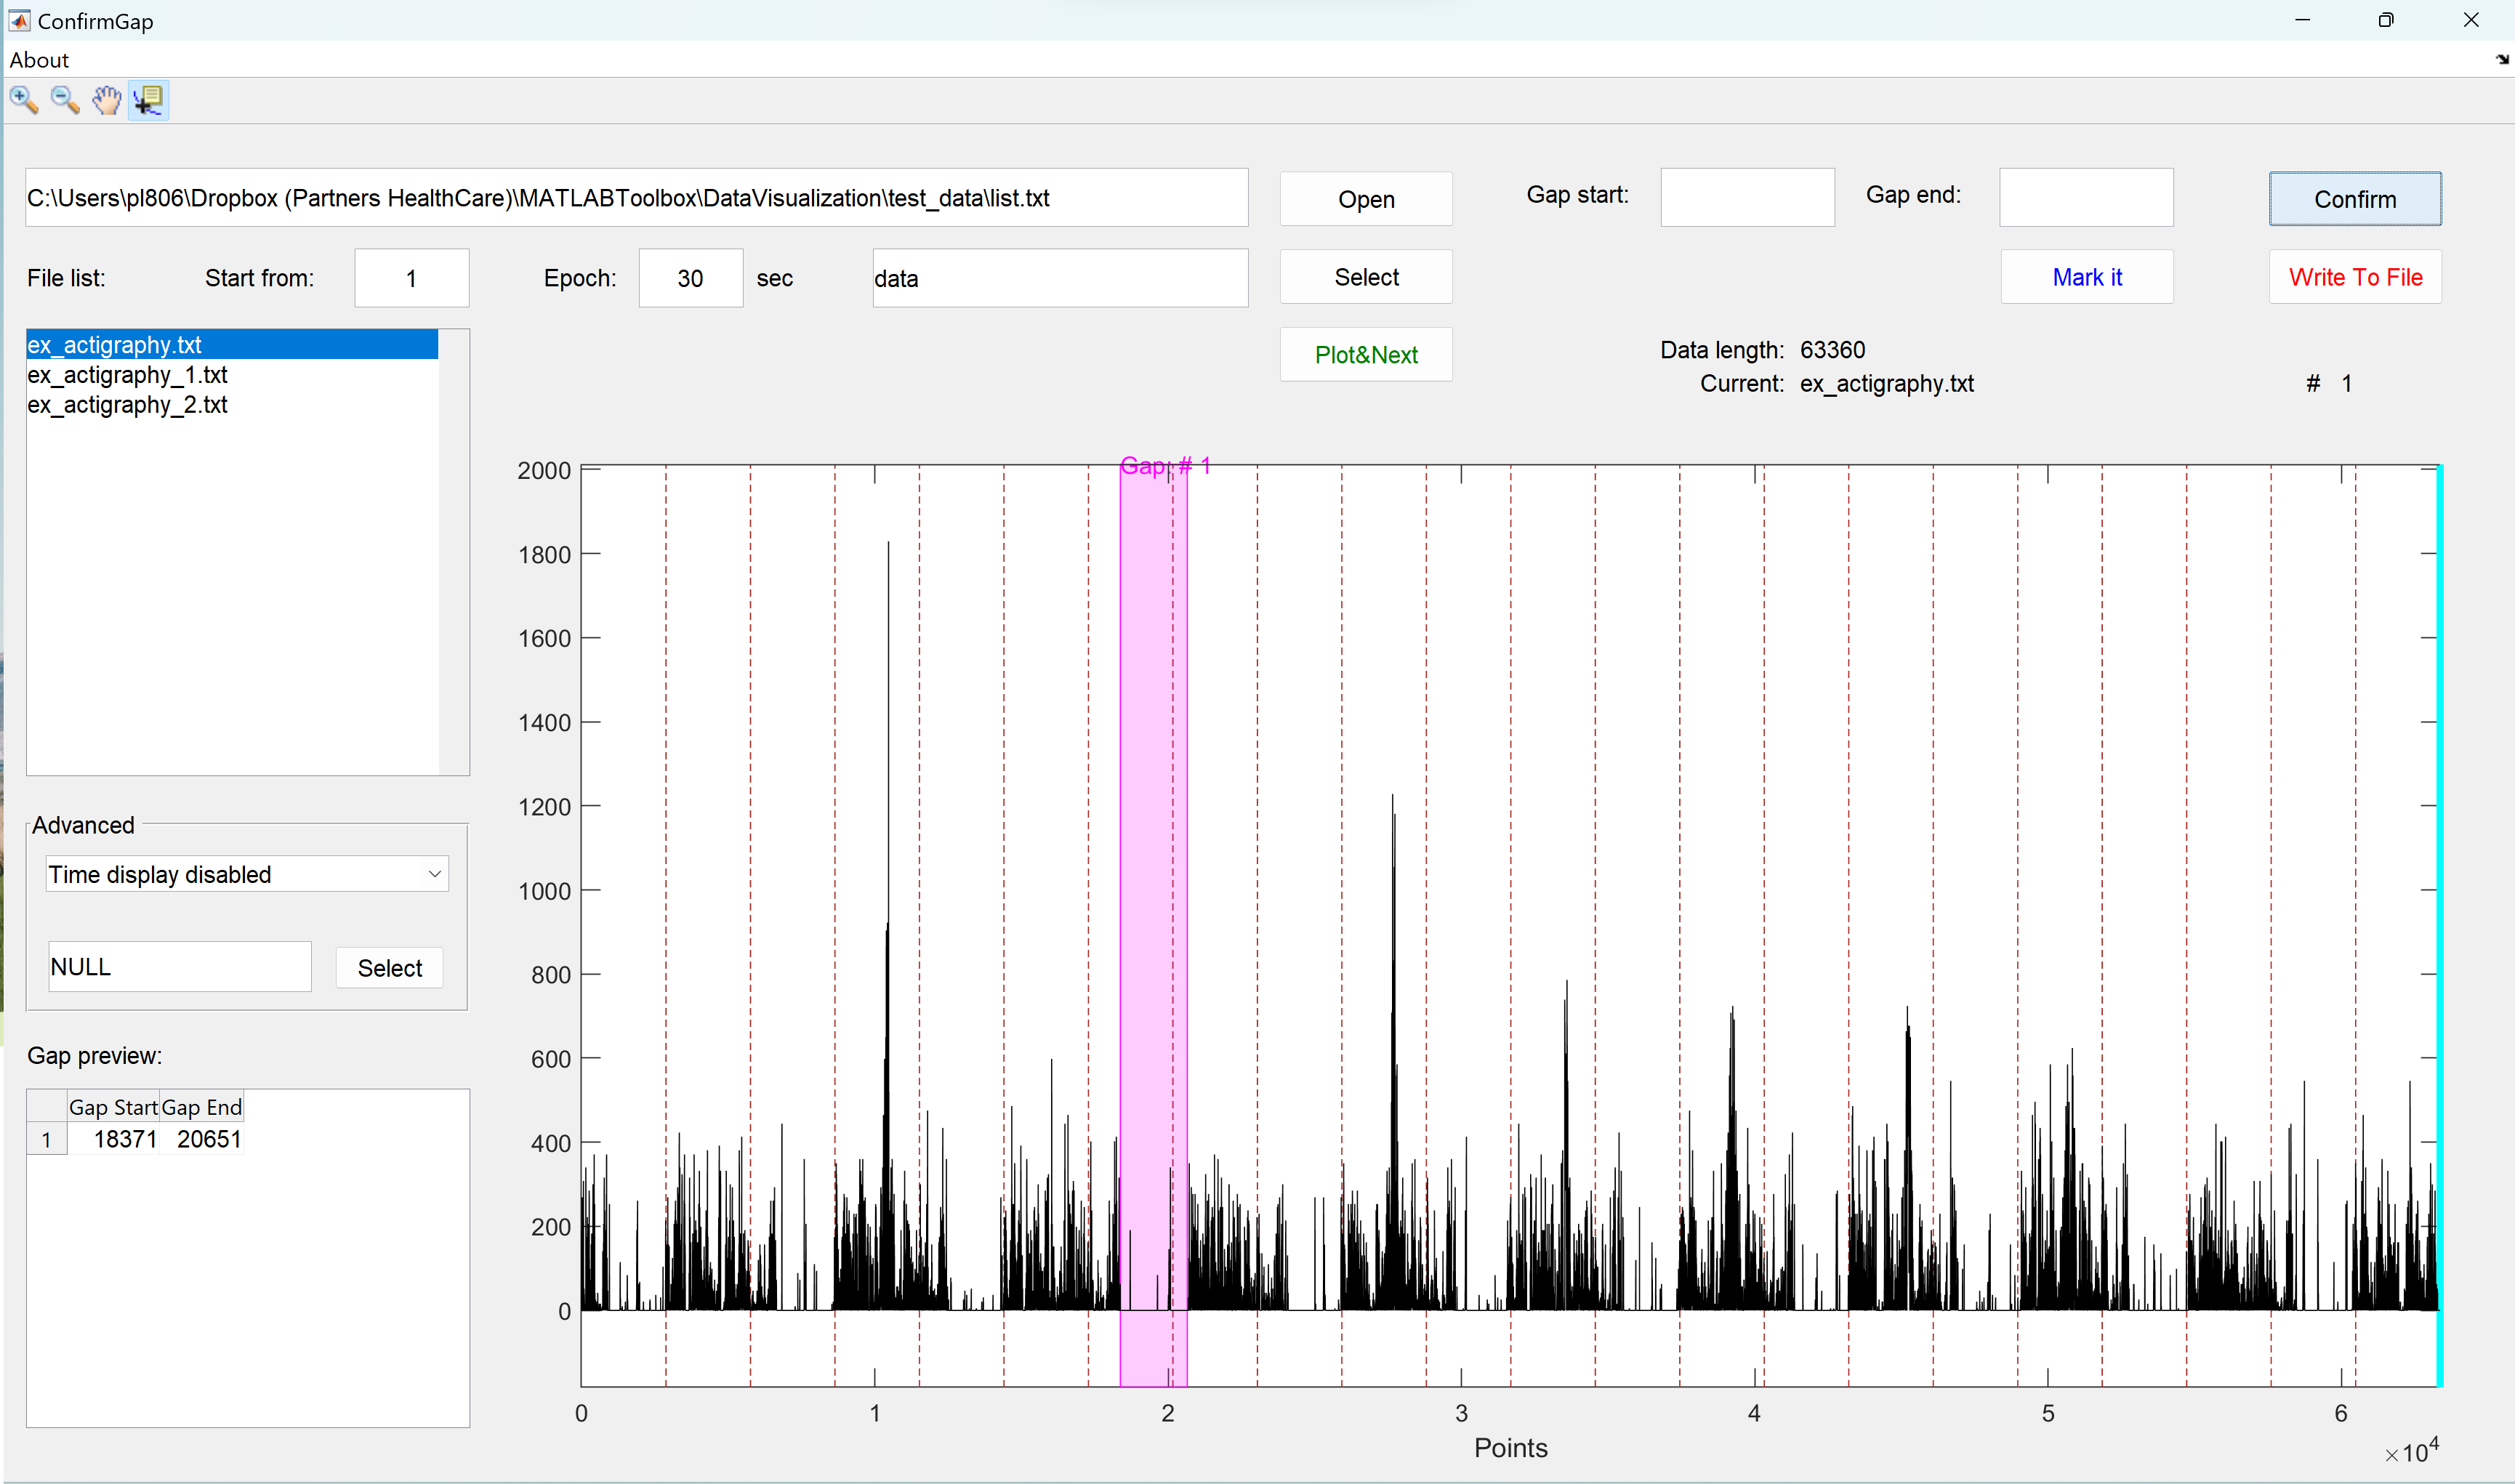
The user interface of ConfirmGap. Credit © Peng Li, Ph.D. 2016-2018
Code-wise, both DefineGap and ConfirmGap were developed based on the classical approach for developing user interfaces in MATLAB©–the GUIDE©. It quickly became complicated to maintain and manage the code as new functions were being added. In early 2018, the object-oriented (OO) structure of MATLAB© became more and more mature, and I started migrating this App to a more manageable programming style based on OO. At the beginning of this attempt, a temporal workaround was being used that relied on the GUIDE© to offer an interface while all functions (i.e., “call-backs of all buttons etc.) were coded through a class. This led to the new release called Gapp.
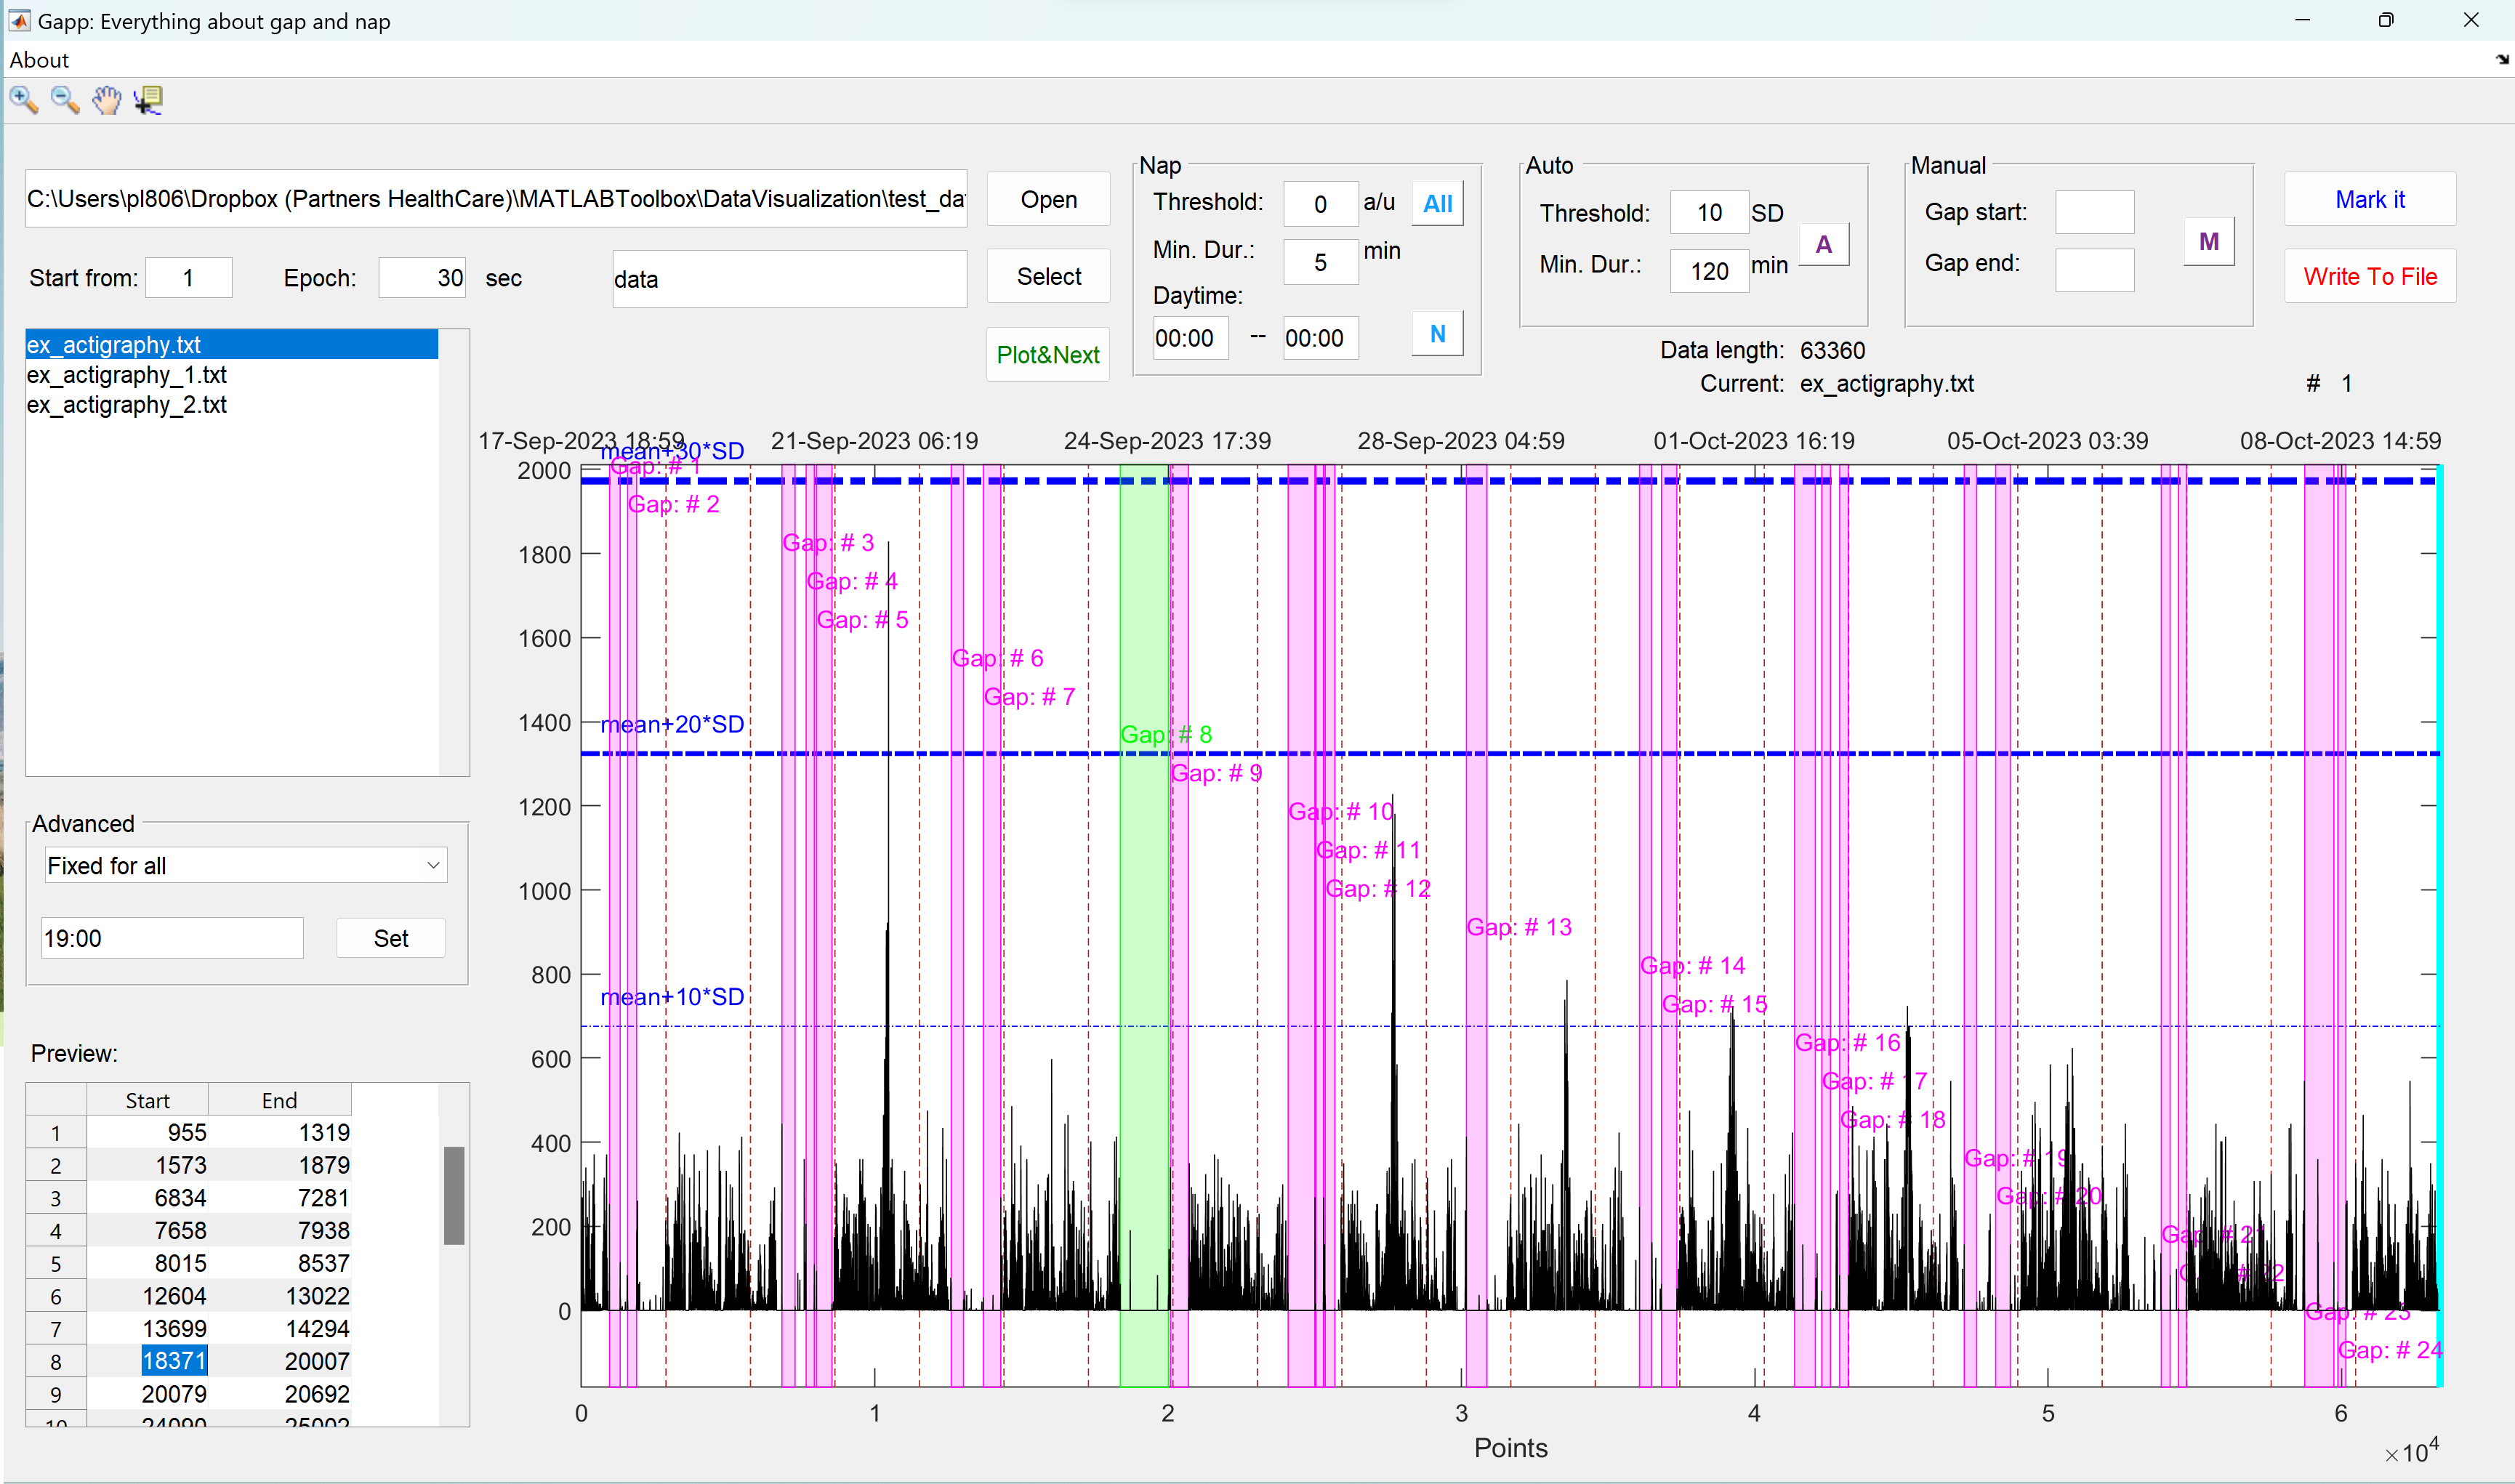
The user interface of Gapp. Credit © Peng Li, Ph.D. 2018-2019
Until the end of 2019, Gapp has been continuedly updated including the addition of a pilot automatic process for sensing gaps and later a function to identify napping episodes with a user-customizable time window for daytime. This nap detection algorithm was pretty pilot and mainly based on activity counts.
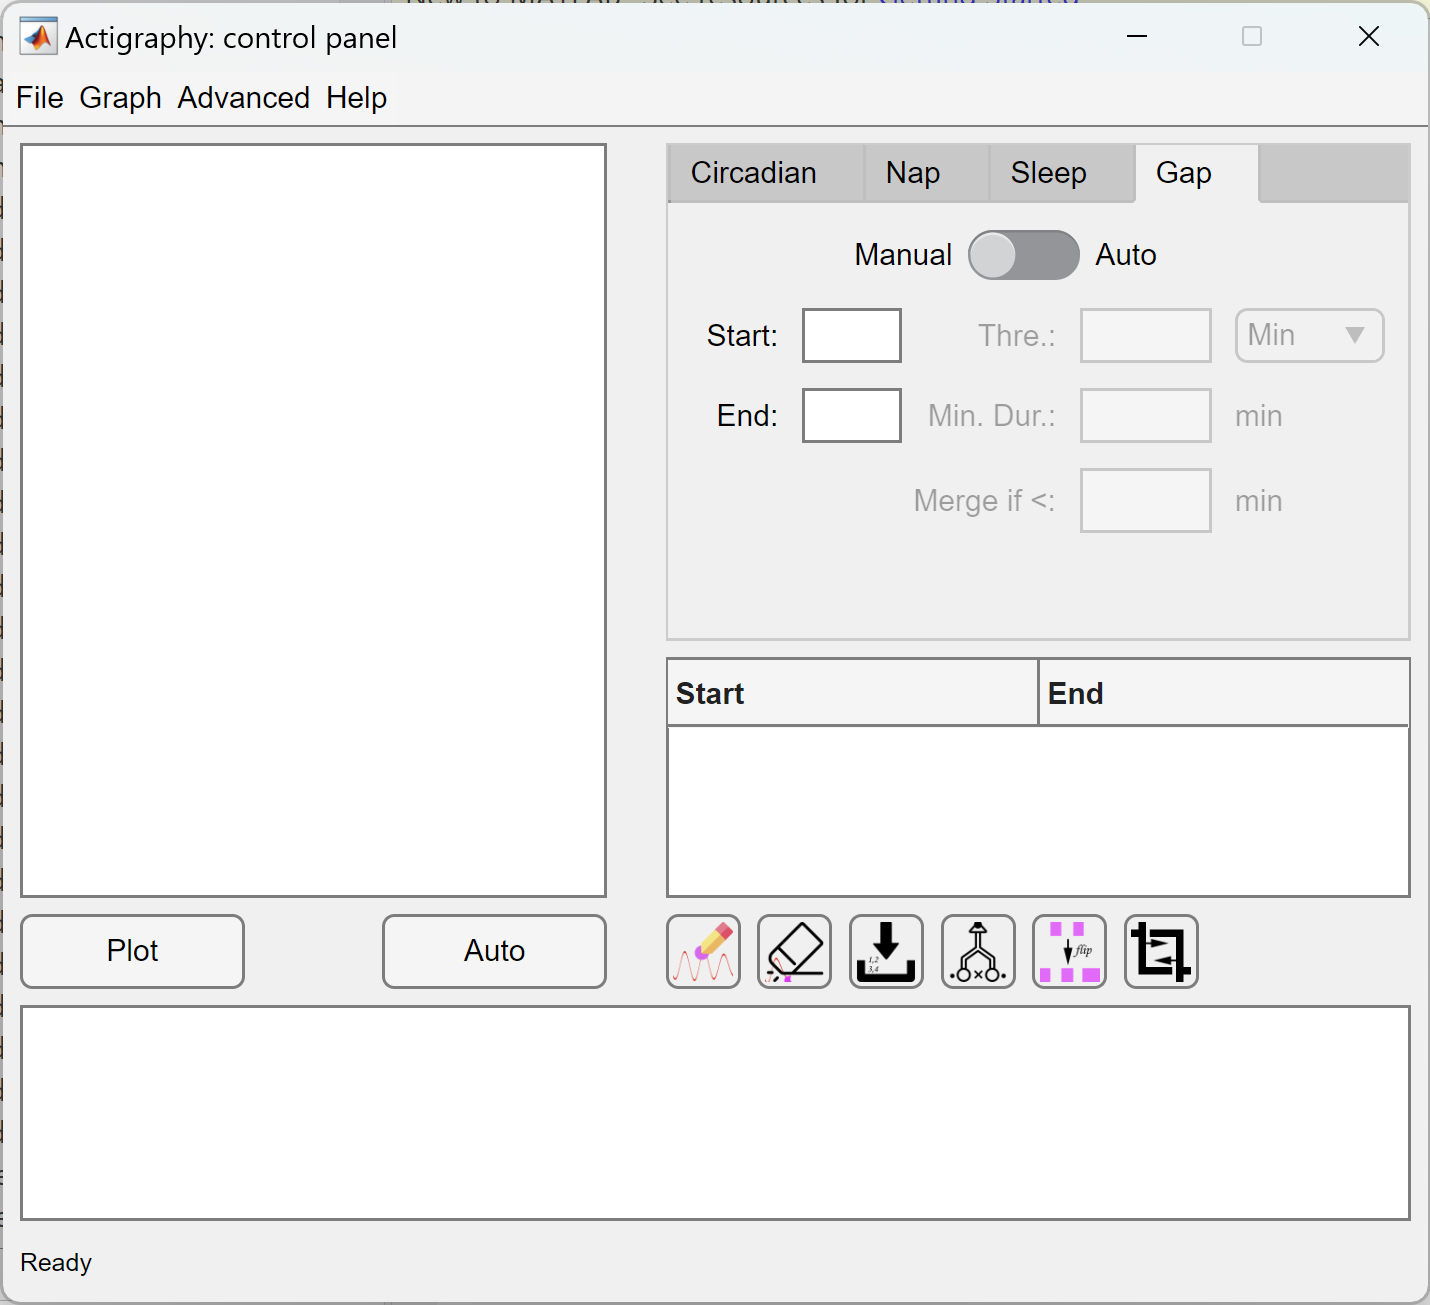
With the continuing effort in streamlining different calculations (including cosinor analysis, detrended fluctuation analysis, etc.), the temporal turnaround by using the GUIDE© to provide an interface became not efficient eventually. In the end of 2019, I finally launched the ezActi project and started refining all of these processes using the modern OO and the AppDesigner© in MATLAB©. This led to the born of the first release of ezActi.
The ezActi started to separate the control panel and the actigraphy display window. It also introduced several different running modes such as the gap detection, sleep and nap detection, as well as circadian analysis. It inherited the process by using a list file to perform batch analysis. It introduced a knob for facilitating the identification of time.
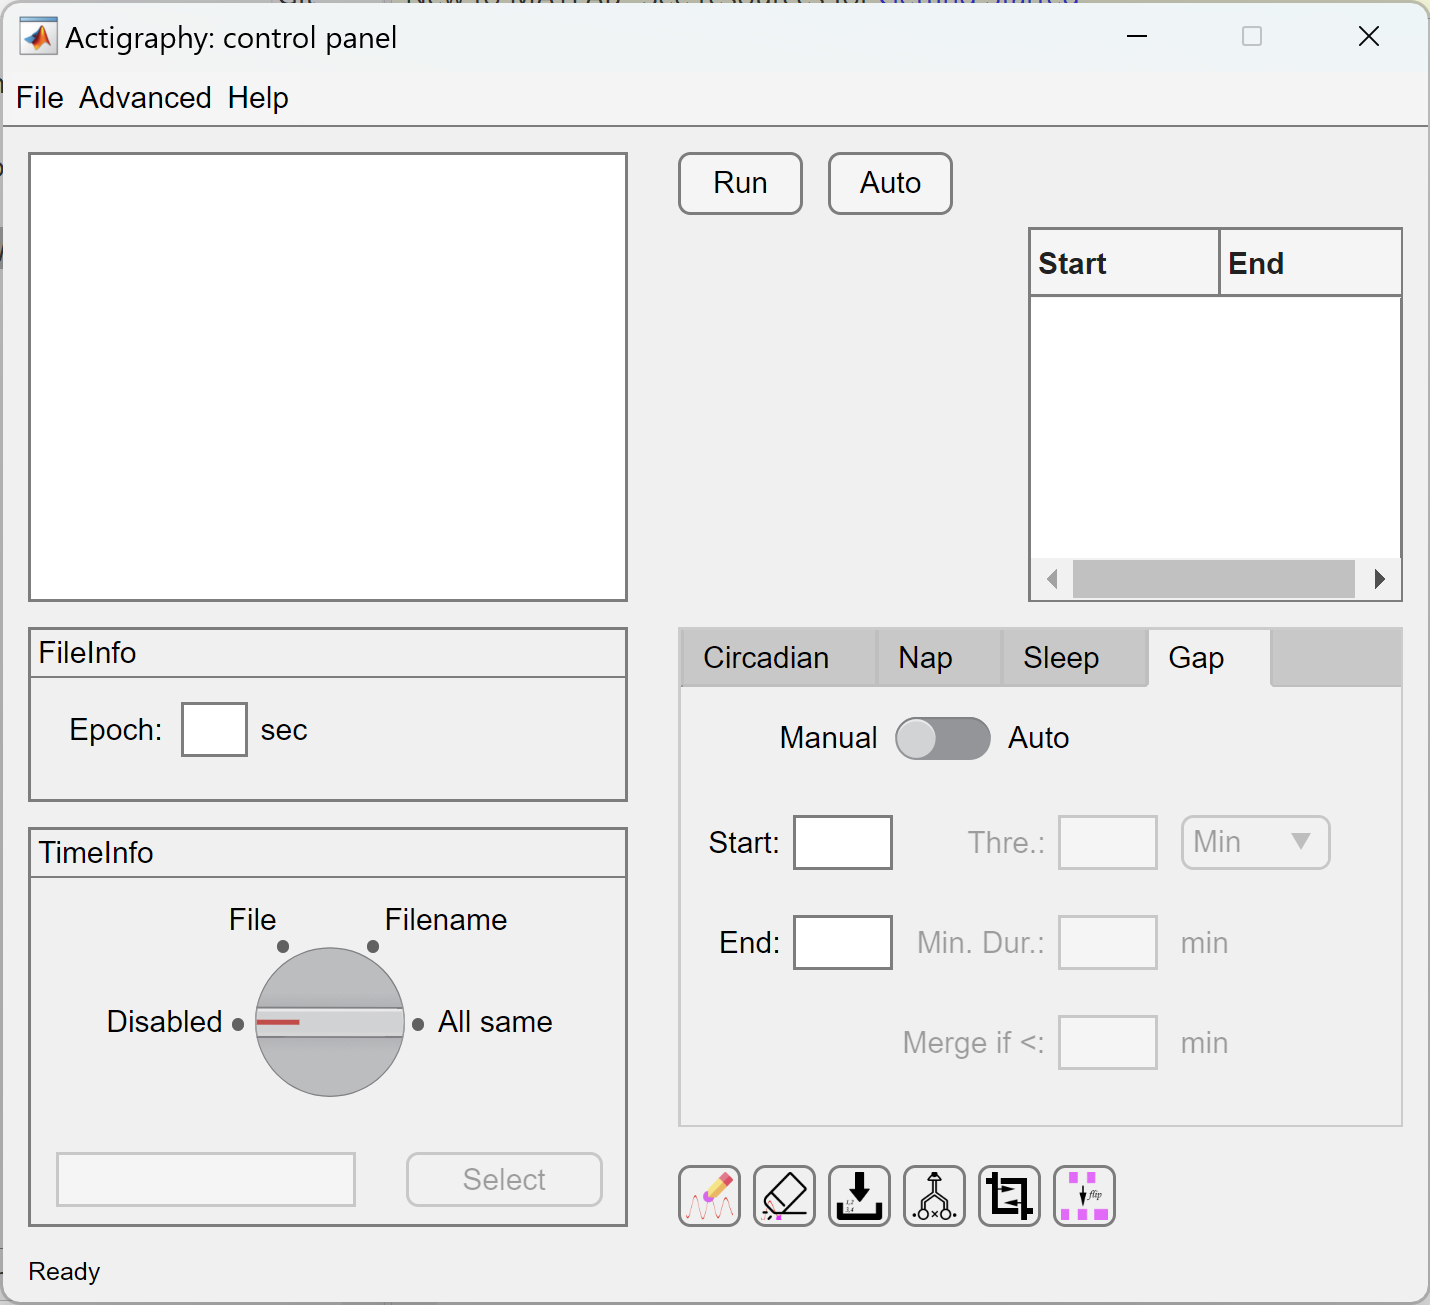
The user interface of ezActi. Credit © Peng Li, Ph.D. 2019-2022
The DFATool and DFAFit were merged into the ezActi with a newly introduced mydfa class, which significantly improved the computational speed (more than 10x faster by a conservatively estimation).
The ezActi2 was first launched in November 2022. The idea of this new release was to feature a brand-new and easily-manageable import wizard and a newly updated actigraphy display window. New functions have been added since then, including structured visualizations and the additions of nonparametric analysis as well as empirical mode decomposition based circadian analysis. The new version also came with several newly introduced classes, including the cosinor class (which was initially implemented in ezActi based on the traditional procedural programming style), the ImportWizard, the new display window actigraphy2, and actogram. The empirical mode decomposition process was currently still based on the procedural style (which calls the built-in emd function).
The user interface of ezActi2. Credit © Peng Li, Ph.D. 2022-2025
The user interface of Import Wizard introduced in ezActi2. Credit © Peng Li, Ph.D. 2022-2025
After its first launch, there have been several rounds of updates to improve the performance of ezActi2. The most significant update is the addition of a new feature that evaluates the signal quality of actigraphy data based on several pre-defined rules. By no means the rules can be exclusive, so the quality control (Auto QC) is still in its beta version at this moment, as I have not come up with a better algorithm to perform the QC. This will hopefully be a focus of a future release.
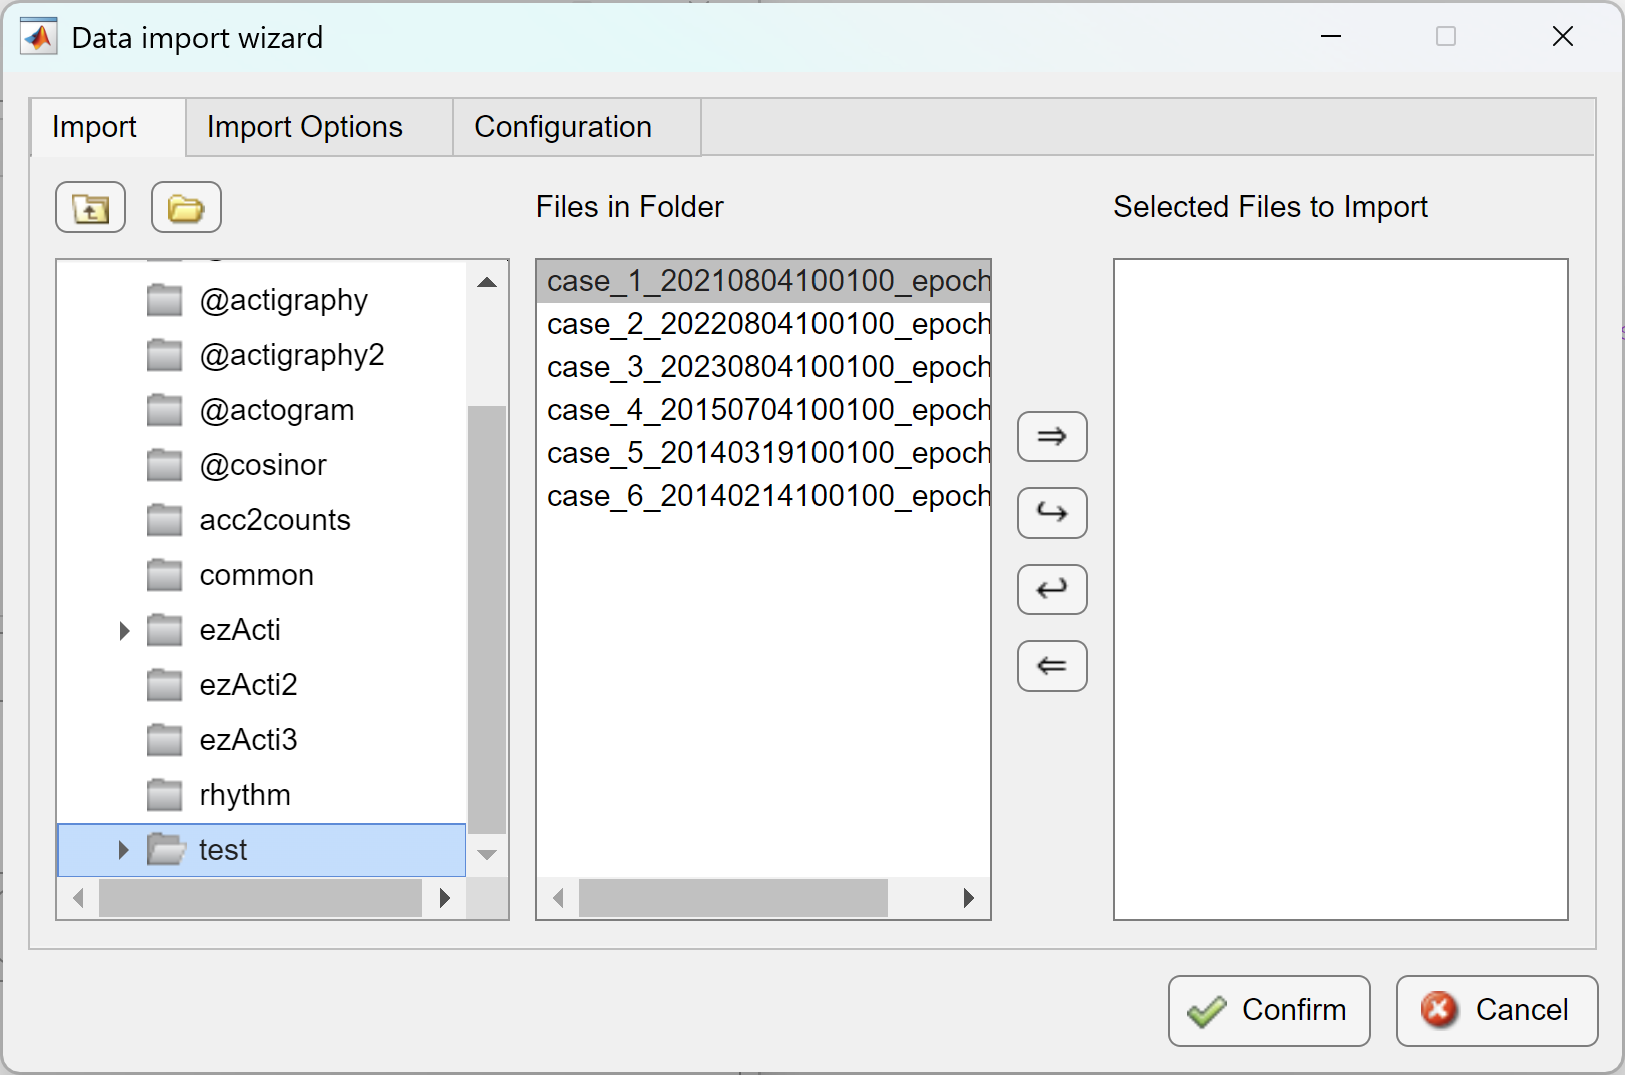
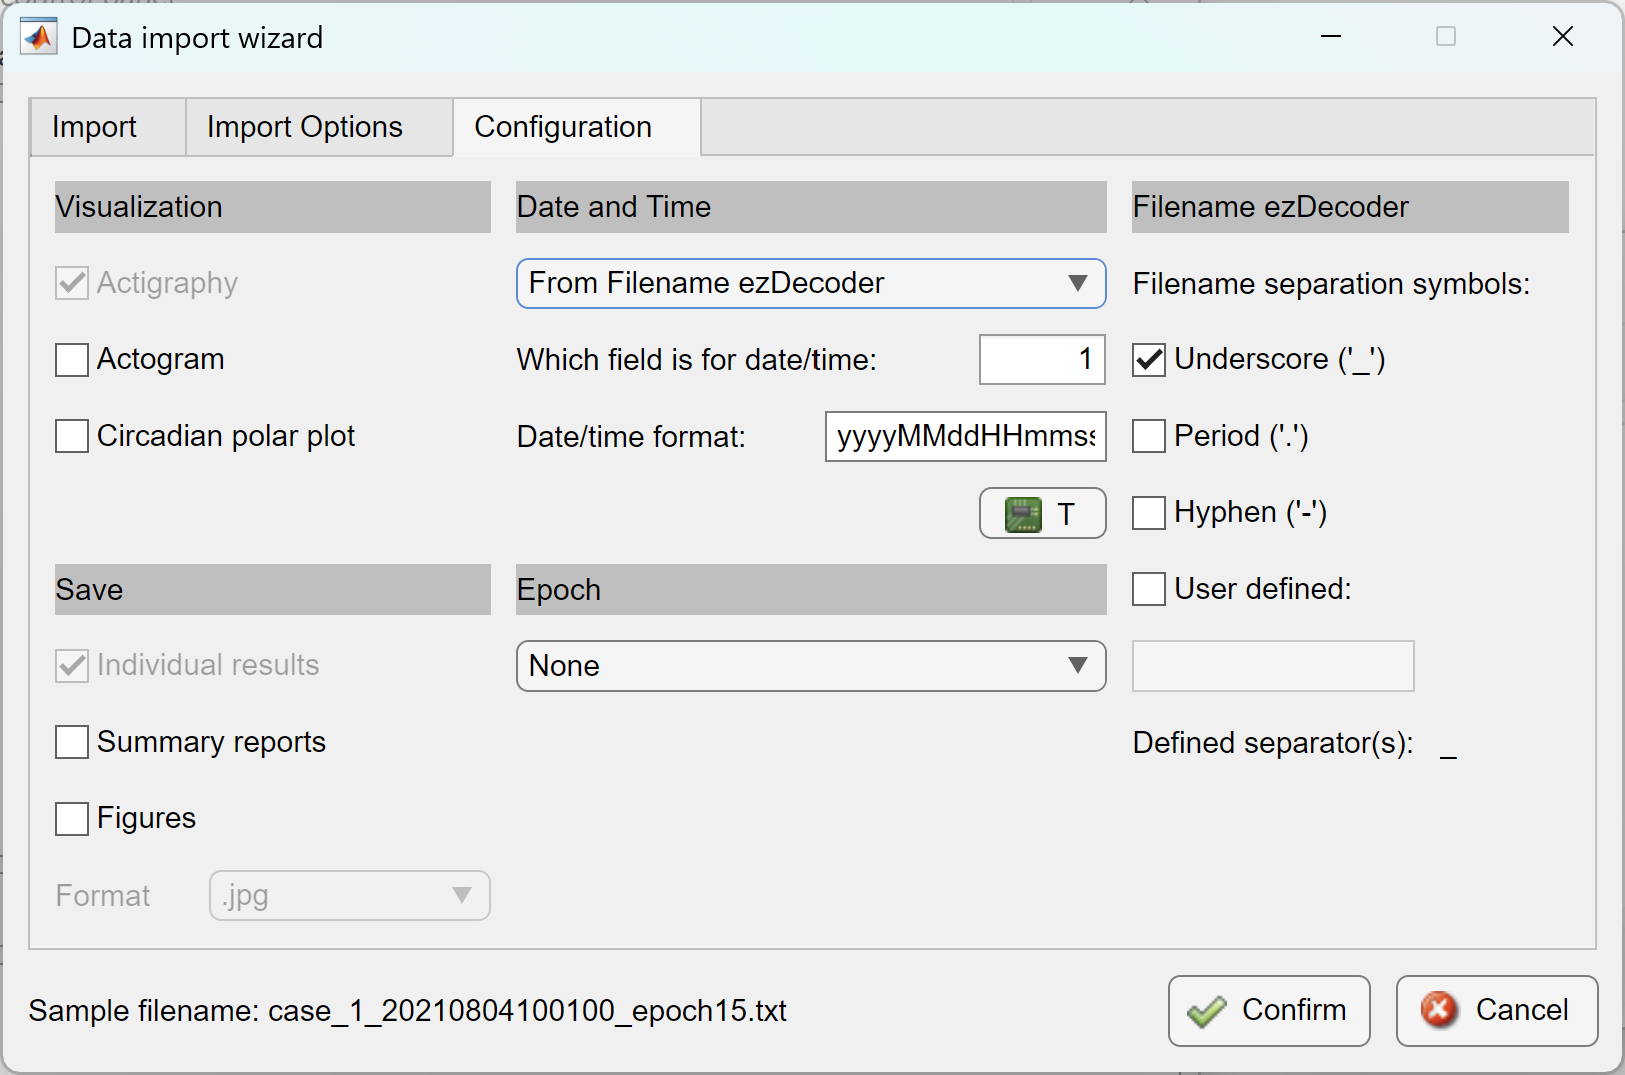
The ezActi3 was first launched in Oct 2025. The idea of this new release was to enable the ability to work with raw 3-dimensional accelerometer signals, as this becomes more popular in modern watches that offer access to raw data. Instead of creating a separate tool or menu item to work with raw data, I decided to upgrade the Import Wizard to enable the import of raw files. This current release of ezActi3 only supports raw files in the format of comma separated file.
The user interface of Import Wizard Ver. 3 introduced in ezActi3. Credit © Peng Li, Ph.D. 2025-
Another major update is the consolidation of sleep and nap detection, as essentially they follow the same algorithm. This consolidation reduces the confusion and offers a simpler way for me to manage the code on the back-end.